Ask Your Question
1

I'm having trouble plotting this population differential equation with five particular solutions all on the same graph. Please help.

asked 2020-02-14 22:16:43 +0200

PolarizedIce gravatar image

updated 2020-02-15 11:02:44 +0200

vdelecroix gravatar image

Here is some code

x,t = var('x,t')
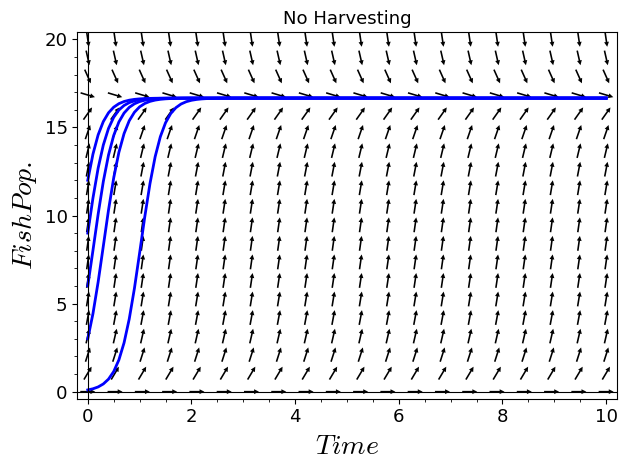
plot1 = plot_slope_field(5*x-.3*x^2-0*t,(t,0,10),(x,0,20),headaxislength=3,headlength=3,axes_labels=['$Time$','$Fish Pop.$'],title="No Harvesting",fontsize=13)
x = function('x')(t)
soln = lambda c:desolve_rk4(diff(x,t)==5*x-.3*x^2-0*t,x,ics=[0,c],end_points=[0,10],ivar=t,step=0.1)
plot2 = lambda c:list_plot(soln(c),plotjoined=True,axes_labels=['$Time$','$Fish Pop.$'],thickness=2)
show(plot1+plot2(12),ymin=0,ymax=20)

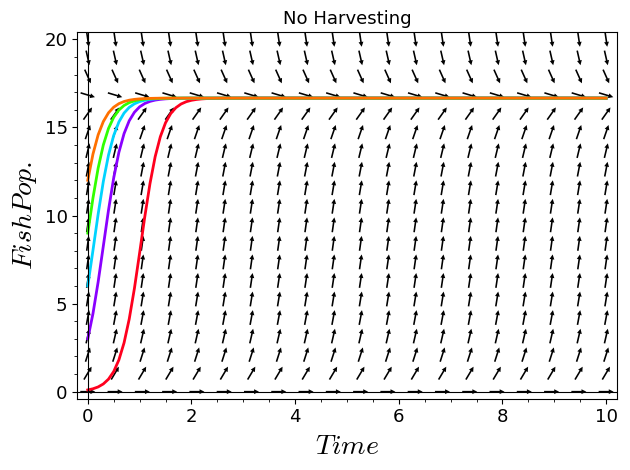
Referencing the last line of code, I wish to input .1, 3, 6, 9, and 12 all at the same time.

edit retag flag offensive close merge delete

1 Answer

Sort by ยป oldest newest most voted
3

answered 2020-02-15 12:29:47 +0200

rburing gravatar image

You can sum the plots:

show(plot1+sum(plot2(c) for c in [.1,3,6,9,12]),ymin=0,ymax=20)

image description

For a better picture, you can change the colors of the individual solutions, e.g.:

plot2 = lambda c, color:list_plot(soln(c),plotjoined=True,axes_labels=['$Time$','$Fish Pop.$'],thickness=2,color=color)
show(plot1+sum(plot2(c,color=tuple(colormaps.hsv(1-c/13)[:3])) for c in [.1,3,6,9,12]),ymin=0,ymax=20)

fish populations

Personally I would also change it to plot until time 3 or so instead of 10, and then use ticks=1.

edit flag offensive delete link more

Your Answer

Please start posting anonymously - your entry will be published after you log in or create a new account.

Add Answer

Question Tools

1 follower

Stats

Asked: 2020-02-14 22:16:43 +0200

Seen: 191 times

Last updated: Feb 15 '20