Revision history [back]
| | 1 | initial version |

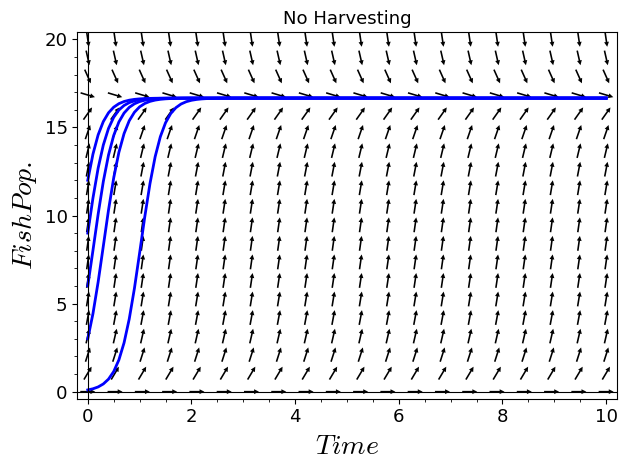
You can sum the plots:
show(plot1+sum(plot2(c) for c in [.1,3,6,9,12]),ymin=0,ymax=20)
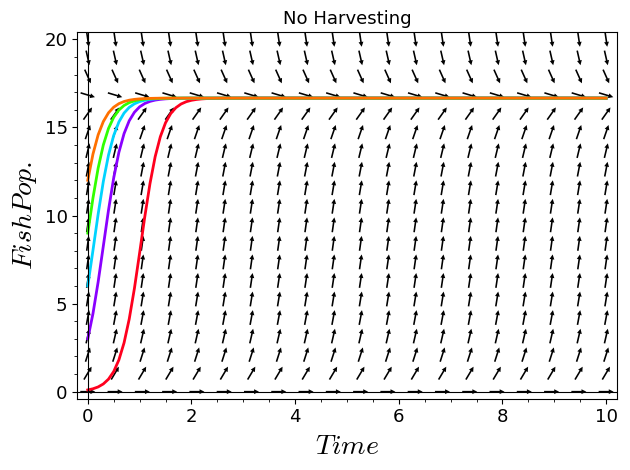
For a better picture, you can change the colors of the individual solutions, e.g.:
plot2 = lambda c, color:list_plot(soln(c),plotjoined=True,axes_labels=['$Time$','$Fish Pop.$'],thickness=2,color=color)
show(plot1+sum(plot2(c,color=tuple(colormaps.hsv(1-c/13)[:3])) for c in [.1,3,6,9,12]),ymin=0,ymax=20)
Personally I would also change it to plot until time 3 or so instead of 10, and then use ticks=1.
