Ask Your Question
0

colorbar and axis labels overlayed - how to fix? (or "how to give parameters to save that i can give to show?")

asked 2019-04-13 11:00:45 +0200

stockh0lm gravatar image

updated 2019-04-13 22:05:48 +0200

This helped me to fix the label on my colorbar, and I have consistent fonts now, too. yay.

however two issues remain:

# Region where contour lines should be plotted
def region_to_include(x,y):
    return (x-.5)^2+(y-.5)^2>0.01 and (x+.5)^2+(y-.5)^2>0.01 and (x-.5)^2+(y+.5)^2>0.01 and (x+.5)^2+(y+.5)^2>0.01
# Region to be excluded
def region_to_exclude(x,y):
    return not region_to_include(x,y)


#=================== visual plausibility check
pic=phi_ges.subs({
    Q   : 1e-9,
    d_e : 1,
    z_s : .25,
    z_c : .5,
    epsilon_m : 76,
    epsilon_s : 21.75,
    epsilon_0 : 8.854187817e-12
})

from matplotlib import rc, rcParams
rc('text',usetex=True)
rc('font',**{'family':'serif','serif':['Computer Modern']})


c = contour_plot(pic, (x,-1,1), (z,-1,1), region=region_to_include, contours= 30, plot_points=200, cmap=colormaps.jet, colorbar=True, axes_labels=['$x$ in [m]','$z$ in [m]'], typeset='latex', frame=True, axes=False)
plt=c[0]
opt = plt.options()
opt['colorbar_options']['label'] = 'Potential in $V$'
plt.set_options(opt)
c[0] = plt


# Plot of the region to be excluded
r = region_plot(region_to_exclude, (x,-1,1), (z,-1,1), 
                plot_points=300, incol="gray", bordercol="black", borderwidth=1)


# Final plot
show(c + r,)
bild=c + r
bild.save('potentialfeld.pdf')

gives me a plot like this:

plot with lables overlayed and two regions white, not grey

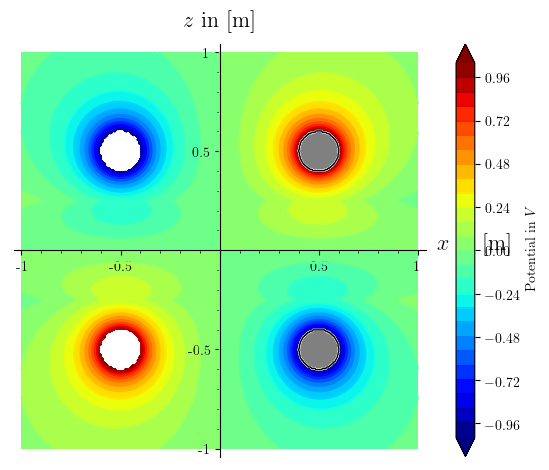
why does my frame=True, axes=False get ignored in the first plot command? It does work if i add those parameters to a separate show command, like show(c+r, frame=True, axes=False), but then i can't save it like that.

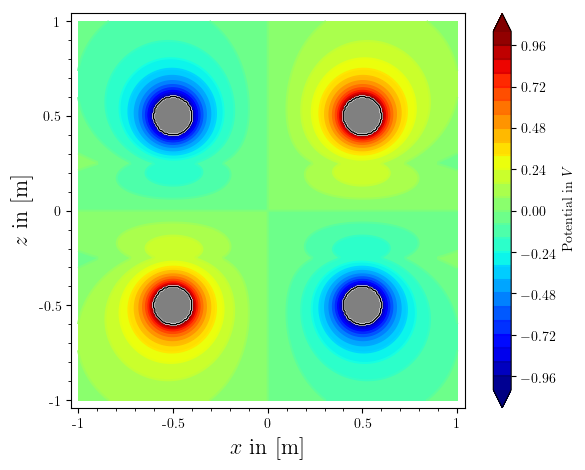
saving the plot manually from within the viewer that show() spawns gives me this pic, as i want it. but i would like to be able to save it from sage directly.

pic as i want it, saved manually

how to fix?

edit retag flag offensive close merge delete

Comments

before i had also asked about an issue with the poles on the left being not greyed out, i found and fixed the typo.

stockh0lm gravatar imagestockh0lm ( 2019-04-13 22:01:47 +0200 )edit

1 Answer

Sort by ยป oldest newest most voted
1

answered 2019-04-13 23:14:16 +0200

dsejas gravatar image

updated 2019-04-13 23:25:50 +0200

Hello, @stockh0lm. I am glad that you could use my last answer.

Let me give you a couple of solutions to your problems. I'll start with the easiest: As far as I'm aware, the frame and axes options are set globally. So when creating plot r, you are automatically overwriting these options with the defaults, namely frame=False and axes=True. One way to solve this is just adding your preferences to the command that defines r:

r = region_plot(region_to_exclude, (x,-1,1), (z,-1,1), 
            plot_points=300, incol="gray", bordercol="black", borderwidth=1, frame=True, axes=False)

That will solve your problem. However, a more elegant way to do this would be to use the same options you have put in show, but in save, i.e., the save command accepts the same options as the show command. In your case, you can use

bild.save('potentialfeld.pdf', axes=False, frame=True)

That way you can save time by not defining these options for c and r repeatedly. (By the way, you don't need the line show(c + r,).) The result should be as follows (I didn't have the definition of your pic, so I used another function, but the idea is there): image description

(The code is located in this Sage Cell)

Now, let's try to solve the $x$ axis label problem. This is a little more complicated (I think). In this case, since you are not plotting axes, the $x$ label should go automatically to the bottom, so it will not interfere anymore.

However, in case you do have a similar problem with another plot, I can suggest two alternatives. First, you could reposition the colorbar. If you want to do this, just add the line

opt['colorbar_options']['orientation'] = 'horizontal'

just after the line opt['colorbar_options']['label'] = 'Potential in $V$' (or just before, in any case). This will put the colorbar bellow your plot, so it will not interfere with axis labels.

A less elegant solution, but useful in some occations is to add line-breaks to the axis labels. Instead of putting axes_labels=['$x$ in [m]','$z$ in [m]']as an option for plot p, you could use axes_labels=['$x$\nin\n[m]','$z$ in [m]']. The \n defines a line-break in that precise place.

edit flag offensive delete link more

Comments

awesome and in depth! thank you!

stockh0lm gravatar imagestockh0lm ( 2019-04-13 23:20:42 +0200 )edit

Your Answer

Please start posting anonymously - your entry will be published after you log in or create a new account.

Add Answer

Question Tools

1 follower

Stats

Asked: 2019-04-13 11:00:45 +0200

Seen: 356 times

Last updated: Apr 13 '19