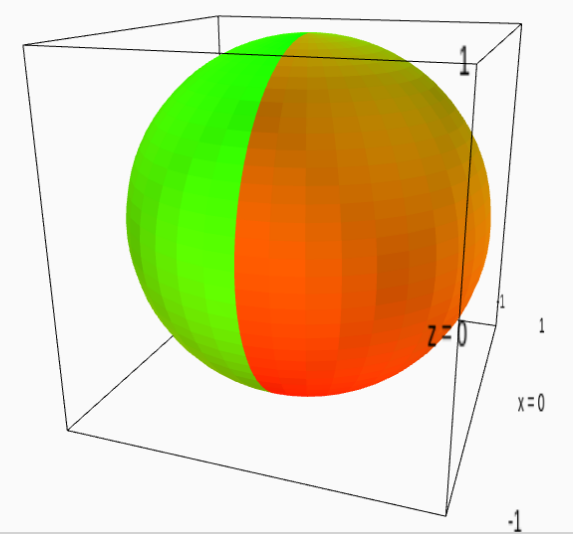
Color parametric_plot3d by a rgb color rather than a colormap.
I know I can color a 3d plot using a function and a color map. What I would like to do is to color a plot using a function that return a rgb color directly.
Specifically, I am trying to plot complex functions on the Riemann sphere. I can show the argument using the HSV color map (which is incorrectly named since it only shows hue, not saturation nor value):
sproj(x,y,z) = (x + I*y)/(1-z)
cf = lambda u,v: N(arg(-f(sproj(cos(u)*cos(v),sin(u)*cos(v),sin(v))))/(2*pi)+0.5)
cm = colormaps.hsv
parametric_plot3d((cos(s)*cos(t),sin(s)*cos(t),sin(t)), (s,-pi,pi),(t,-pi/2,pi/2), color = (cf,cm))
This does not show the modulus, though. I would like to be able to do something like this:
sproj(x,y,z) = (x + I*y)/(1-z)
cf = lambda u,v: complex_to_rgb(-f(sproj(cos(u)*cos(v),sin(u)*cos(v),sin(v))))
parametric_plot3d((cos(s)*cos(t),sin(s)*cos(t),sin(t)), (s,-pi,pi),(t,-pi/2,pi/2), color = cf)


