Ask Your Question
2

Color parametric_plot3d by a rgb color rather than a colormap.

asked 2017-01-25 19:43:23 +0200

Jan Hlavacek gravatar image

I know I can color a 3d plot using a function and a color map. What I would like to do is to color a plot using a function that return a rgb color directly.

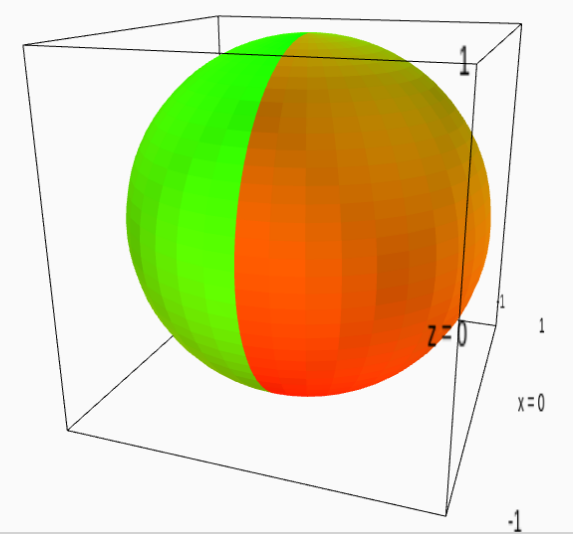
Specifically, I am trying to plot complex functions on the Riemann sphere. I can show the argument using the HSV color map (which is incorrectly named since it only shows hue, not saturation nor value):

sproj(x,y,z) = (x + I*y)/(1-z)
cf = lambda u,v: N(arg(-f(sproj(cos(u)*cos(v),sin(u)*cos(v),sin(v))))/(2*pi)+0.5)
cm = colormaps.hsv
parametric_plot3d((cos(s)*cos(t),sin(s)*cos(t),sin(t)), (s,-pi,pi),(t,-pi/2,pi/2), color = (cf,cm))

This does not show the modulus, though. I would like to be able to do something like this:

sproj(x,y,z) = (x + I*y)/(1-z)
cf = lambda u,v: complex_to_rgb(-f(sproj(cos(u)*cos(v),sin(u)*cos(v),sin(v))))
parametric_plot3d((cos(s)*cos(t),sin(s)*cos(t),sin(t)), (s,-pi,pi),(t,-pi/2,pi/2), color = cf)
edit retag flag offensive close merge delete

1 Answer

Sort by ยป oldest newest most voted
3

answered 2017-01-26 01:19:58 +0200

fidbc gravatar image

All you need to do is create your own colormap. Strictly speaking a colormap is a function $cm:[0,1]\longrightarrow [0,1]^4 $, where $x\mapsto (r(x),g(x),b(x),\alpha(x))$ (here $\alpha$ indicates transparency). In the end, the point $(s,t,F(s,t))$ will be coloured $cm(cf(s,t))$.

For example:

var('s,t')
F(s,t)=(cos(s)*cos(t),sin(s)*cos(t),sin(t))
cf = lambda s,t: ((s+pi)/(2*pi))/2+((t+pi/2)/pi)/2
cm = lambda x: (1-x,x,0,1)
parametric_plot3d(F(s,t), (s,-pi,pi),(t,-pi/2,pi/2), color = (cf,cm))

results in

image description

edit flag offensive delete link more

Your Answer

Please start posting anonymously - your entry will be published after you log in or create a new account.

Add Answer

Question Tools

Stats

Asked: 2017-01-25 19:43:23 +0200

Seen: 405 times

Last updated: Jan 26 '17