Revision history [back]
| | 1 | initial version |

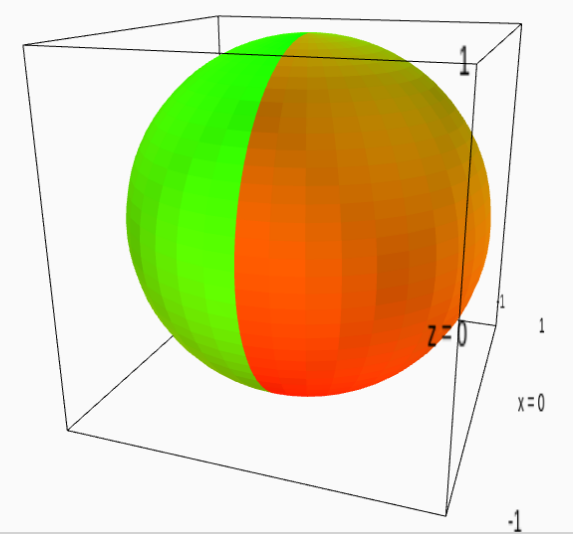
All you need to do is create your own colormap. Strictly speaking a colormap is a function $cm:[0,1]\longrightarrow [0,1]^4 $, where $x\mapsto (r(x),g(x),b(x),\alpha(x))$ (here $\alpha$ indicates transparency). In the end, the point $(s,t,F(s,t))$ will be coloured $cm(cf(s,t))$.
For example:
var('s,t')
F(s,t)=(cos(s)*cos(t),sin(s)*cos(t),sin(t))
cf = lambda s,t: ((s+pi)/(2*pi))/2+((t+pi/2)/pi)/2
cm = lambda x: (1-x,x,0,1)
parametric_plot3d(F(s,t), (s,-pi,pi),(t,-pi/2,pi/2), color = (cf,cm))
results in