Ask Your Question
3

plotting regions in 3D

asked 2013-09-21 20:53:44 +0200

anonymous user

Anonymous

updated 2020-05-22 14:00:37 +0200

FrédéricC gravatar image

I have recently learned to plot regions in the xy-plane as follows:

region_plot([y - 2*x<= 0, 0<x, x<2, 0<y, y<3], (x, -3, 3), (y, -3, 3))

My question is: How do I plot the same region, but living in 3-space? How do I add an extra condition (namely, z=0) so that the region appears in 3-space? The reason I ask is that I want to plot a two-variable function and its region of integration in the same plot.

edit retag flag offensive close merge delete

3 Answers

Sort by » oldest newest most voted
2

answered 2013-09-22 07:03:23 +0200

tmonteil gravatar image

updated 2013-09-22 07:03:44 +0200

You can use implicit_plot3d as follows:

sage: region = implicit_plot3d(z, (x, -3, 3), (y, -3, 3), (z, -3, 3), plot_points=100, region=lambda x,y,z: y - 2*x<= 0 and 0<x and x<2 and 0<y and y<3)
sage: region.show()
edit flag offensive delete link more

Comments

Thank you for your help. What does that lambda command do? Also, suppose I want to extend that region upward; that is, let z >=0 and get a solid. Is there an easy tweak to your code to do that?

strangelove1221 gravatar imagestrangelove1221 ( 2013-09-22 12:38:50 +0200 )edit

This comment box destroys some symbols, see my answer below.

tmonteil gravatar imagetmonteil ( 2013-09-22 15:22:59 +0200 )edit
4

answered 2020-05-22 16:41:03 +0200

Juanjo gravatar image

updated 2020-05-23 13:35:41 +0200

Although the syntax

region = implicit_plot3d(equation, range_x, range_y, range_z, region=restrictions)
region.show()

works well, I recommend to use this other approach:

region = implicit_plot3d(equation, range_x, range_y, range_z, region=restrictions)
region = region.add_condition(restrictions)
region.show()

Compare, for example, the output of

var("x,y,z")
region = implicit_plot3d(z==0, (x, -3, 3), (y, -3, 3), (z, -3, 3),
                         region=lambda x,y,z: y - 2*x<= 0 and 0<x and x<2 and 0<y and y<3)
region.show()

and

var("x,y,z")
region = implicit_plot3d(z==0, (x, -3, 3), (y, -3, 3), (z, -3, 3))
region = region.add_condition(lambda x,y,z: y - 2*x<= 0 and 0<x and x<2 and 0<y and y<3)
region.show()

Off course, adding the plot_points option, you can improve both pictures.

I conjecture that, given a bounded region $D\subset\mathbb{R}^2$ and a non-negative, integrable function $f:D\to\mathbb{R}$, you want to explain that $\iint_D f(x,y)\,dx\,dy$ is the volumen of the solid

$$ Q=\{(x,y,z)\in\mathbb{R}^3 \mid (x,y)\in D,\ 0\leq z\leq f(x,y)\}. $$

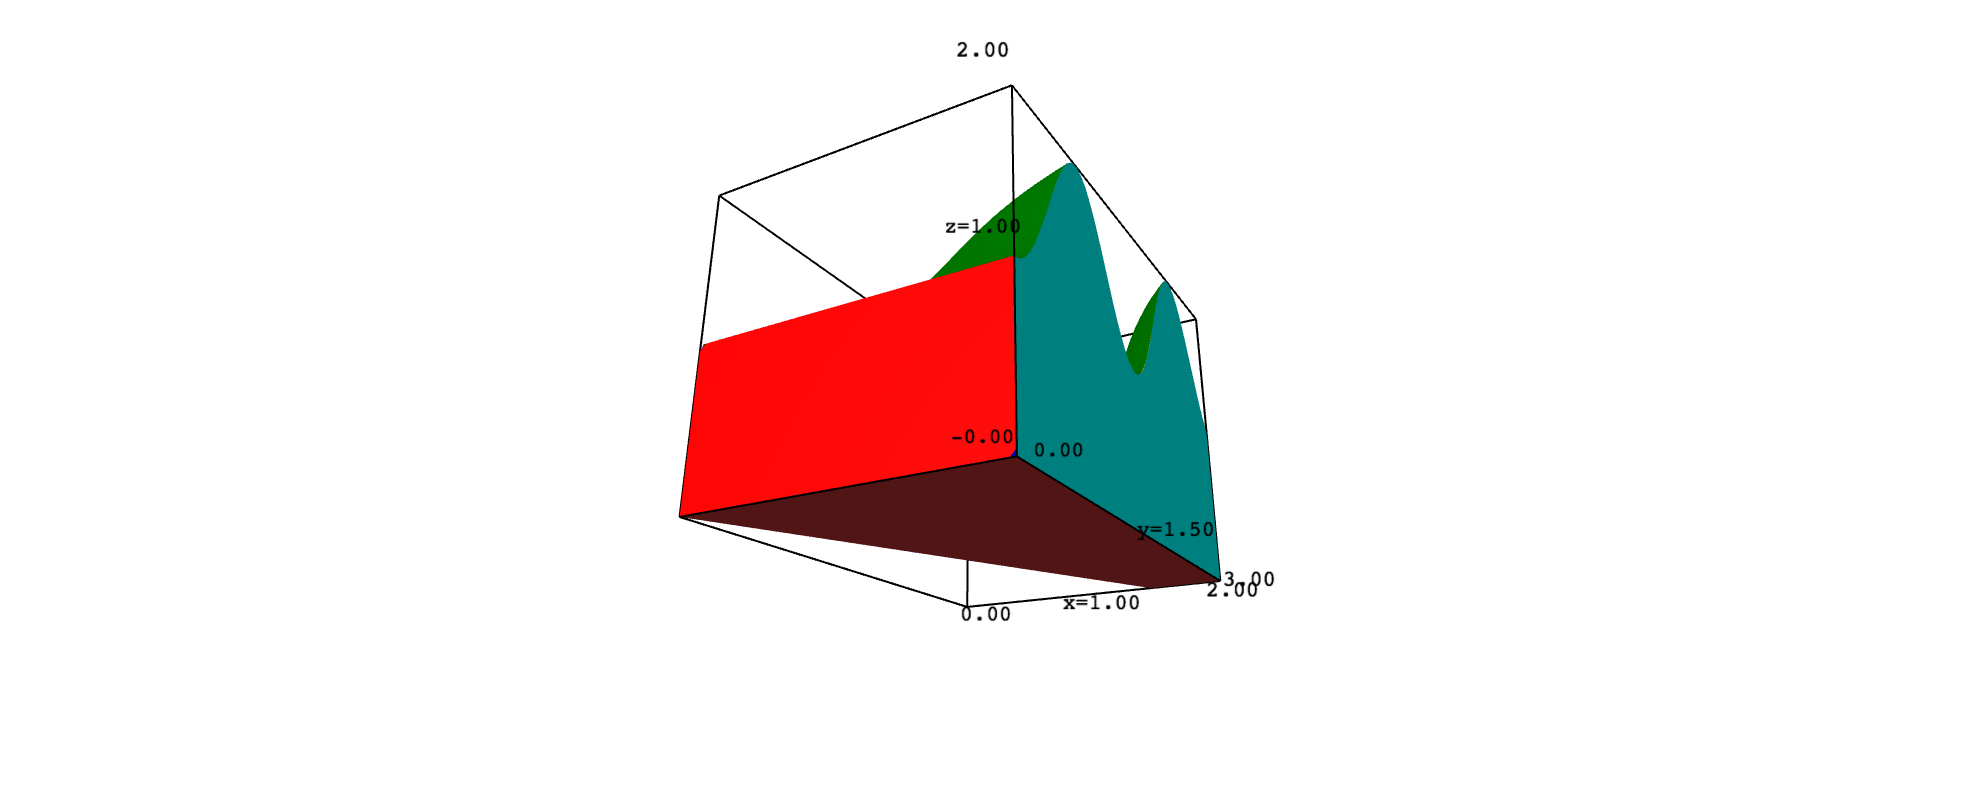
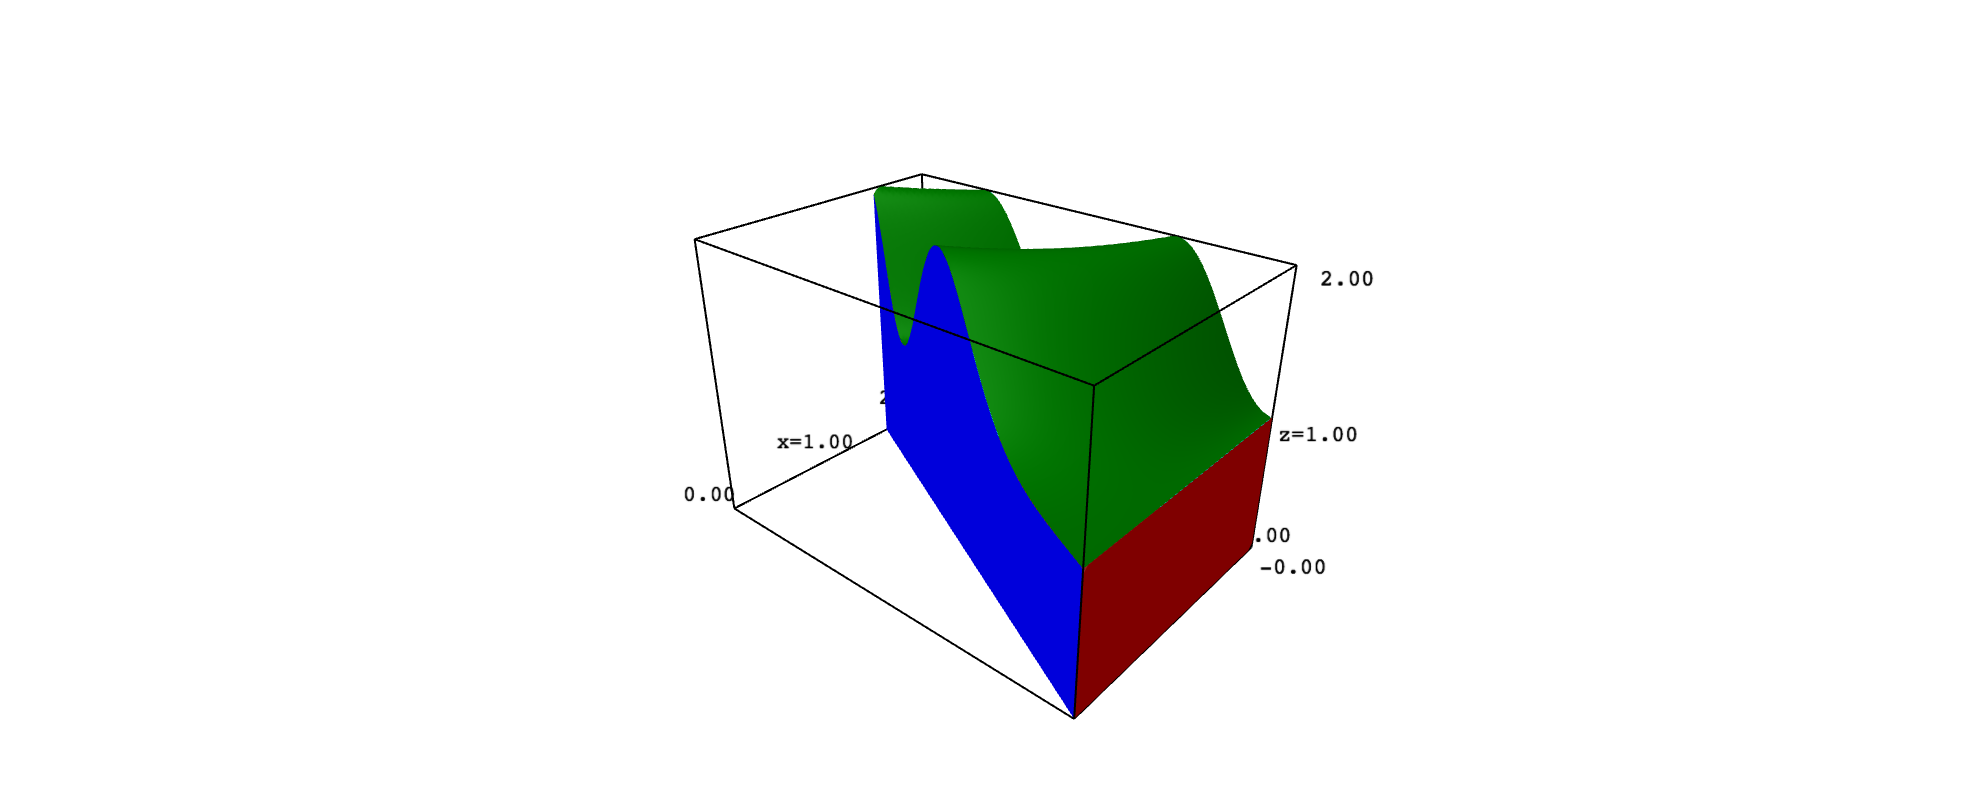
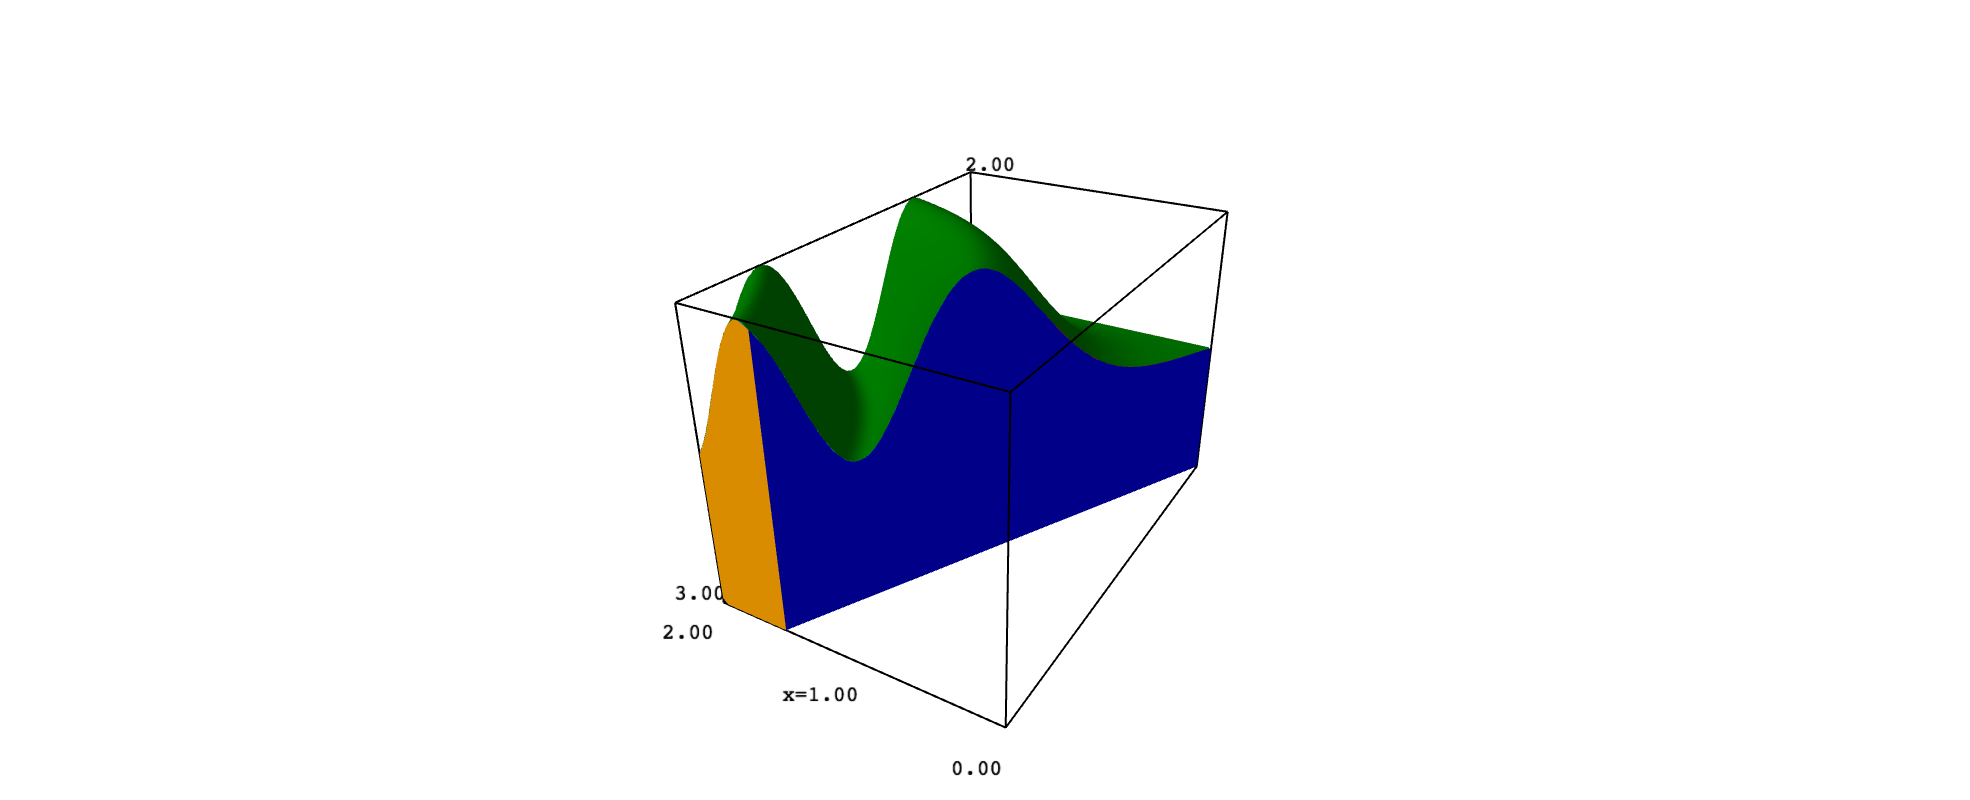
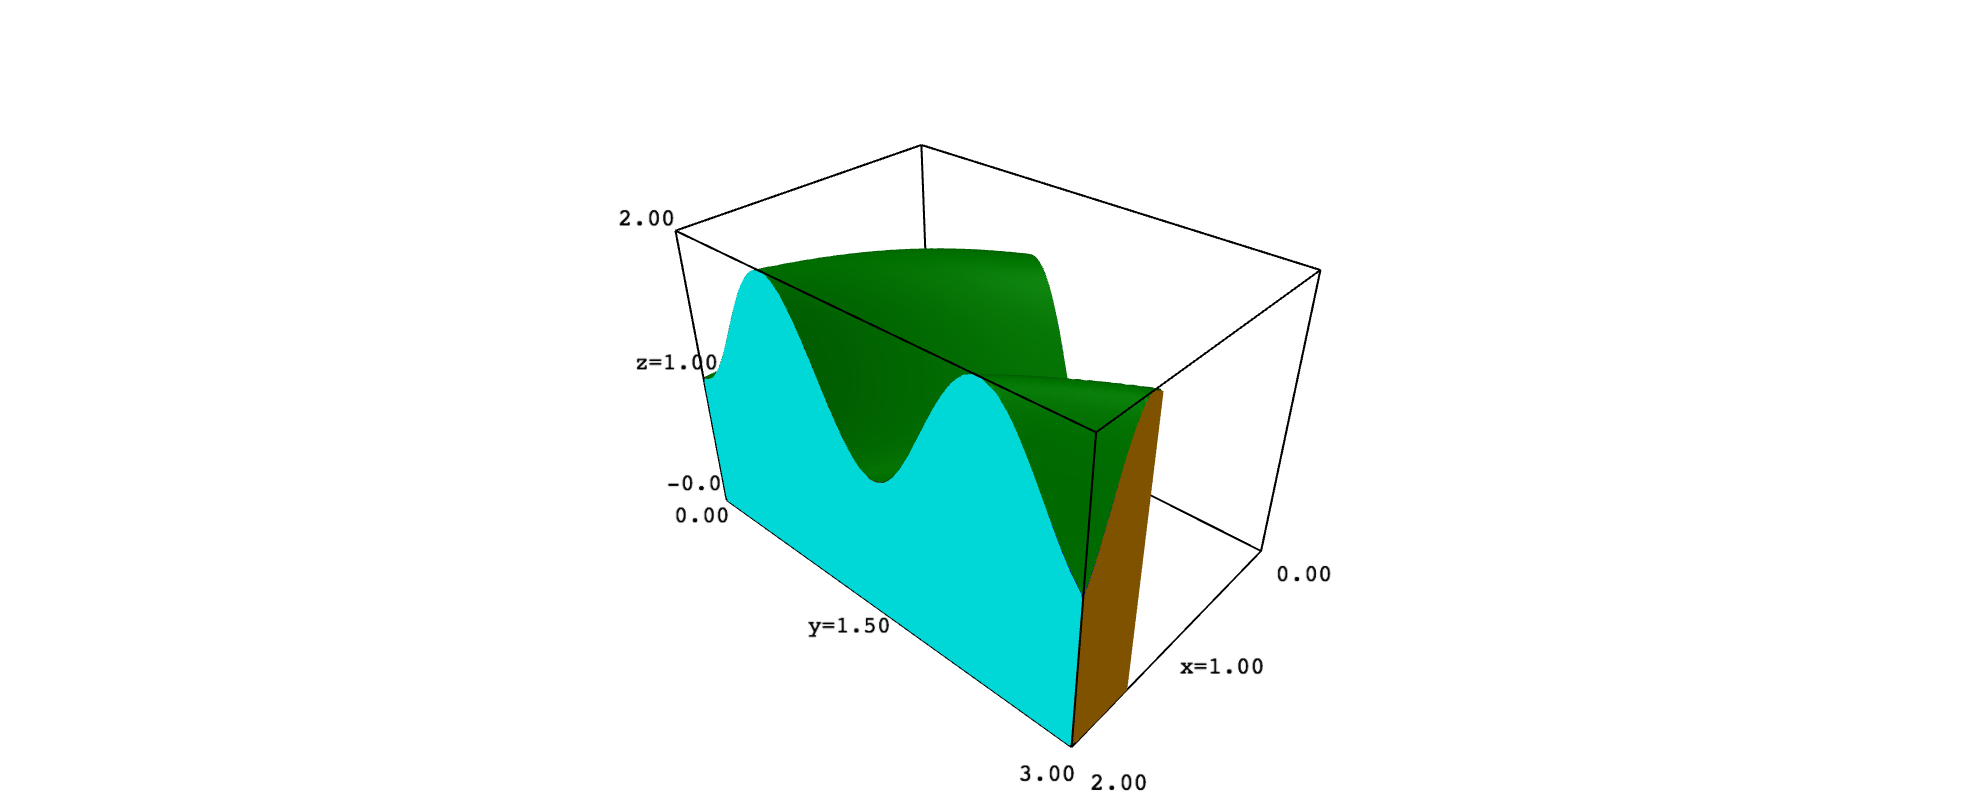
This may explain why you want to plot $D$ in 3D space and why you ask in a comment how to get a solid. Consider, for example, that $D$ is the region you gave and that $f(x,y)=1+\sin^2(xy)$. In such a case, the solid $Q$ has six faces, which are portions of the graph of $f$ and the planes $x=2$, $y-2x=0$, $y=0$, $y=3$ and $z=0$. To keep things simple, you can plot each face with implicit_plot3d, adding the restrictions needed to get the exact portion that limits $Q$. However, the top surface looks better if obtained with plot3d. The following code implements these ideas:

var("x,y,z")
range_x = (x, -0.5, 2.5)
range_y = (y, -0.5, 3.5)
range_z = (z, -0.5, 2.5)

f(x,y) = 1 + sin(x*y)^2

top = plot3d(f(x,y), range_x, range_y, color="green", plot_points=100)
top = top.add_condition(lambda x,y,z: 0<=x<=2 and 0<=y<=3 and y-2*x<=0)

bottom = implicit_plot3d(z==0, range_x, range_y, range_z, color="brown")
bottom = bottom.add_condition(lambda x,y,z: 0<=x<=2 and 0<=y<=3 and y-2*x<=0)

front = implicit_plot3d(y==0, range_x, range_y, range_z, color="red")
front = front.add_condition(lambda x,y,z: 0<=x<=2 and y-2*x<=0 and 0<=z<=f(x,y))

back = implicit_plot3d(y==3, range_x, range_y, range_z, color="orange")
back = back.add_condition(lambda x,y,z: bool(0<=x<=2 and y-2*x<=0 and 0<=z<=f(x,y)))

left = implicit_plot3d(y-2*x==0, range_x, range_y, range_z, color="blue")
left = left.add_condition(lambda x,y,z: 0<=x<=2 and 0<=y<=3 and 0<=z<=f(x,y))

right = implicit_plot3d(x==2, range_x, range_y, range_z, color="cyan")
right = right.add_condition(lambda x,y,z: 0<=y<=3 and 0<=z<=f(x,y))

show(top + bottom + front + back + left + right)

I offer several screenshots:

screenshotscreenshot screenshotscreenshot

edit flag offensive delete link more

Comments

I have just realized that the question, updated by @FrédéricC, was asked in 2013. It is a bit difficult that the OP reads this answer. Anyway, it may be helpful for anyone else.

Juanjo gravatar imageJuanjo ( 2020-05-22 18:38:01 +0200 )edit

This was very helpful for me. Thank you.

RyanG gravatar imageRyanG ( 2020-05-22 21:28:58 +0200 )edit

@Juanjo what is graph, in your code above ?

ortollj gravatar imageortollj ( 2020-05-23 07:41:26 +0200 )edit

@ortollj, sorry, graph should be top. In the first version of my code, I used plot3d to get the graph of $f$, and named it graph. Later I changed it to top and used implicit_plot3d ... but I forgot to modify the argument of show. In fact, the surface in the pictures is generated with plot3d. I have edited my answer to correct these questions. Thanks for pointing them up.

Juanjo gravatar imageJuanjo ( 2020-05-23 13:32:58 +0200 )edit
1

answered 2013-09-22 15:27:56 +0200

tmonteil gravatar image

updated 2013-09-22 15:29:06 +0200

The line

lambda x,y,z: y - 2*x<= 0 and 0<x and x<2 and 0<y and y<3

just defines a function that takes x,y,z as arguments, and that returns the boolean (y - 2*x<= 0 and 0<x and x<2 and 0<y and y<3).

To solve your second question, one could think about defining

sage: implicit_plot3d(0, (x, -3, 3), (y, -3, 3), (z, -3, 3), plot_points=100, region=lambda x,y,z: y - 2*x<= 0 and 0<x and x<2 and 0<y and y<3).show()

but the function 0 does not define a surface but a volume, and plot3d does not show anything.

A possible workaround could be to plot many parallel surfaces:

sage: implicit_plot3d(z, (x, -3, 3), (y, -3, 3), (z, -3, 3), plot_points=100, contour=[i/100 for i in range(100)], region=lambda x,y,z: y - 2*x<= 0 and 0<x and x<2 and 0<y and y<3).show()
edit flag offensive delete link more

Your Answer

Please start posting anonymously - your entry will be published after you log in or create a new account.

Add Answer

Question Tools

Stats

Asked: 2013-09-21 20:53:44 +0200

Seen: 2,567 times

Last updated: May 23 '20