I am trying to produce Cayley graphs for finite groups defined using presentations, but I am getting strange results.
For example, the following should produce the Cayley graph for the cyclic group with 3 elements:
F.<x> = FreeGroup()
rel = [ x^3 ]
G = F/rel
C = G.cayley_graph()
C.plot()
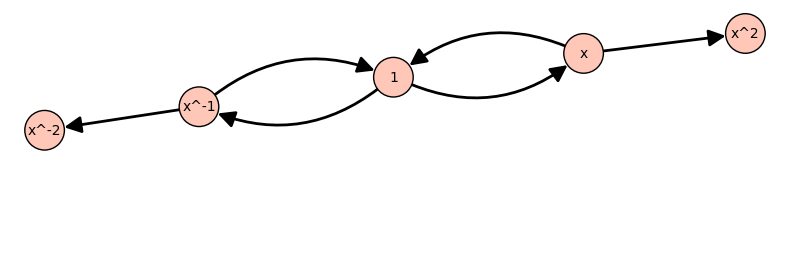
but the graph produced has 4 vertices (sorry I can't upload an image).
If I tell Sage the list of elements like so:
F.<x> = FreeGroup()
rel = [ x^3 ]
G = F/rel
L = G.list()
C = G.cayley_graph(elements = L,generators = [x,x^-1])
C.plot()
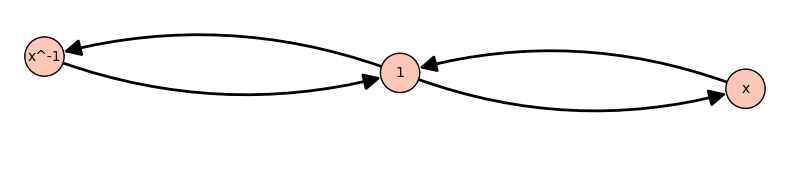
then the number of vertices is correct, but there are no edges between $x$ and $x^{-1}(=x^2)$.
Does anyone know how to fix this?