Ask Your Question
1

Draw a list of continuously colored points

asked 2024-01-25 11:09:24 +0200

Emm gravatar image

updated 2024-01-25 18:35:45 +0200

I have a list of point and use list_point to draw it. Let’s say

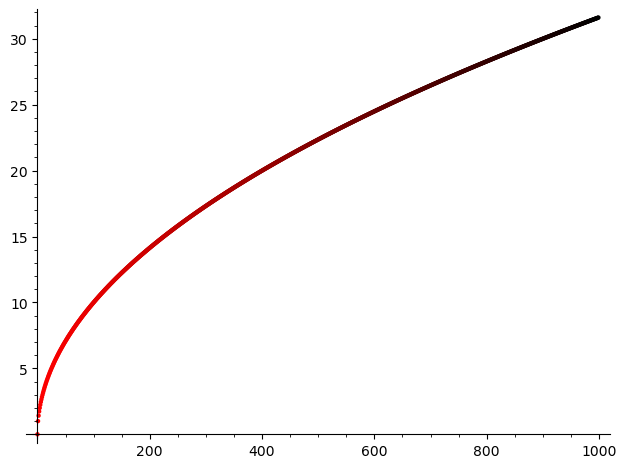
L=[[k,sqrt(k)] for k in range (1000)]
list_plot(L)

I'd like to color the points in a continuous way, to remember the order in which they were drawn. Let's say from the black for the first point on the list to the red for the last.

How can I achieve my goal?

edit retag flag offensive close merge delete

1 Answer

Sort by » oldest newest most voted
3

answered 2024-01-26 02:59:00 +0200

dan_fulea gravatar image

Here is a way, i tried in hurry:

N = 1000
R = range(N)

def myrgbcolor(k):
    # you may try also some other functions to have variation of colors
    # return hue(1/4 + k/2/N)
    # return hue(k/N)
    # return Color(1 - k^2/N^2, 0, 0)
    return Color(1 - k/N, 0, 0)    # r, g, b entries in Color in interval (0, 1), red is (1, 0, 0), black is (0, 0, 0)

points = [point((k, sqrt(k)), rgbcolor=myrgbcolor(k)) for k in R]
G = sum(points)

# viewer.png_viewer('feh')    # for me - just to prevent the default firefox to get a new tab...
G.show()

sqrt function plotted from red to black

edit flag offensive delete link more

Your Answer

Please start posting anonymously - your entry will be published after you log in or create a new account.

Add Answer

Question Tools

Stats

Asked: 2024-01-25 11:09:24 +0200

Seen: 431 times

Last updated: Jan 26