Revision history [back]
| | 1 | initial version |
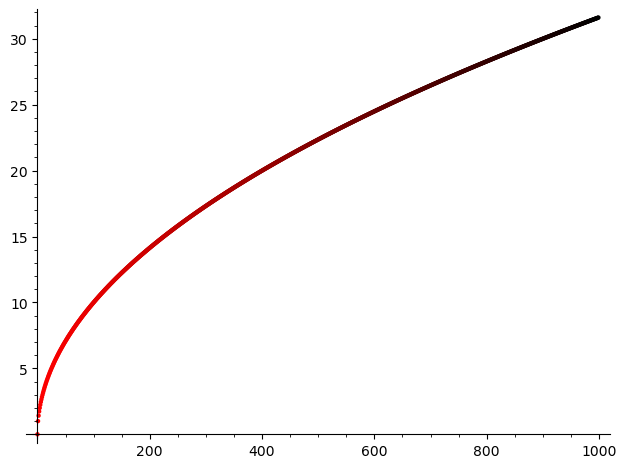
Here is a way, i tried in hurry:
N = 1000
R = range(N)

def myrgbcolor(k):
    # you may try also some other functions to have variation of colors
    # return hue(1/4 + k/2/N)
    # return hue(k/N)
    # return Color(1 - k^2/N^2, 0, 0)
    return Color(1 - k/N, 0, 0)    # r, g, b entries in Color in interval (0, 1), red is (1, 0, 0), black is (0, 0, 0)

points = [point((k, sqrt(k)), rgbcolor=myrgbcolor(k)) for k in R]
G = sum(points)

# viewer.png_viewer('feh')    # for me - just to prevent the default firefox to get a new tab...
G.show()