Ask Your Question
2

Mysterious Disappearance of an edge

asked 2023-07-04 14:03:04 +0200

licheng gravatar image

updated 2023-07-04 16:50:28 +0200

Software version: Sage 10.0

The following codes can find all connected subgraphs.

g = graphs.CubeGraph(2)
subgraphs = list(g.connected_subgraph_iterator())
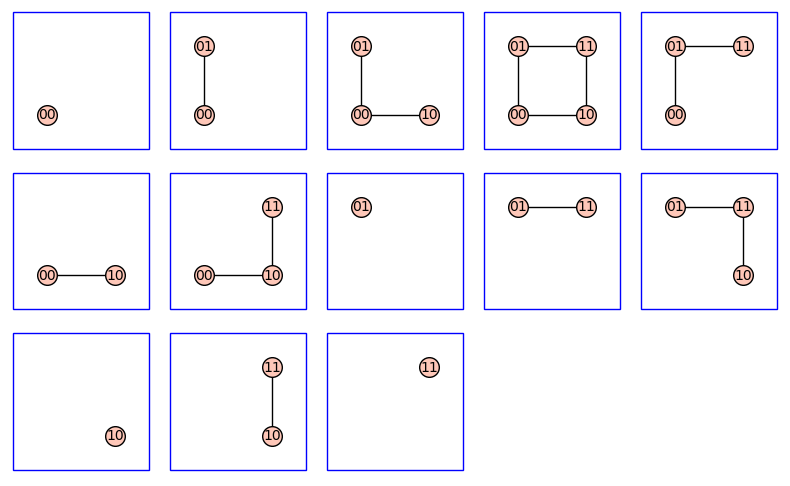
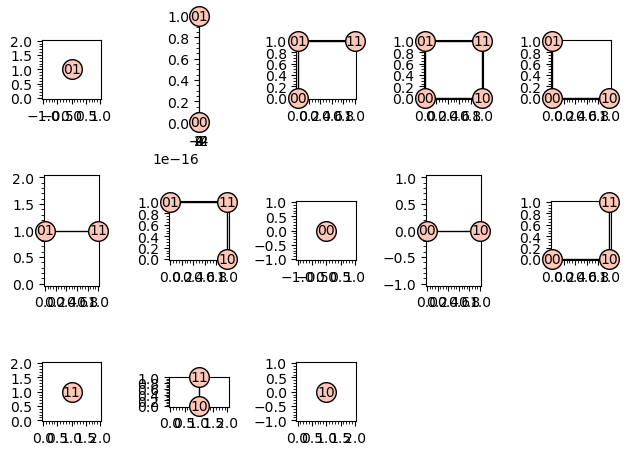
G=graphics_array([[v.plot() for v in subgraphs]],3,5)
G.show(axes=False, frame=False, figsize=5)

We will notice that there is an image missing an edge (due to the non-unique nature of iteration order, in my execution, it is the 6th one, and its image should be one edge instead of two isolated vertices).

image description

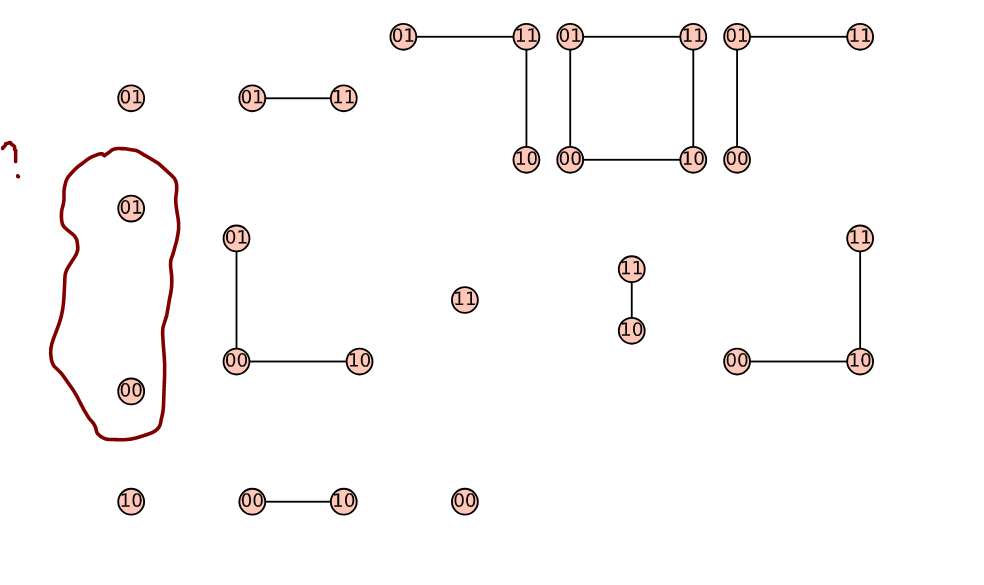
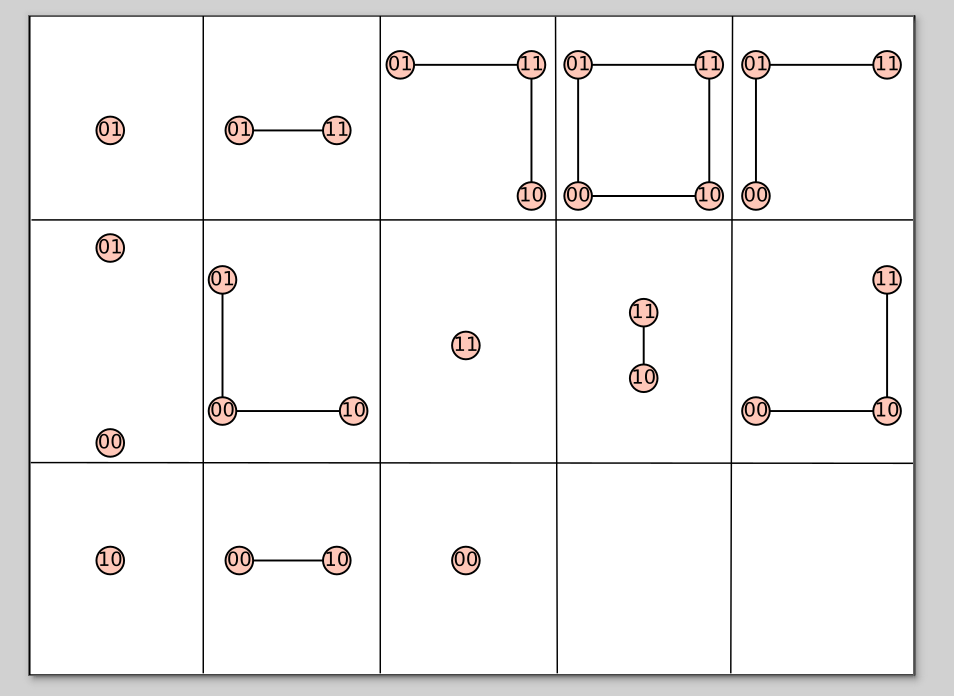
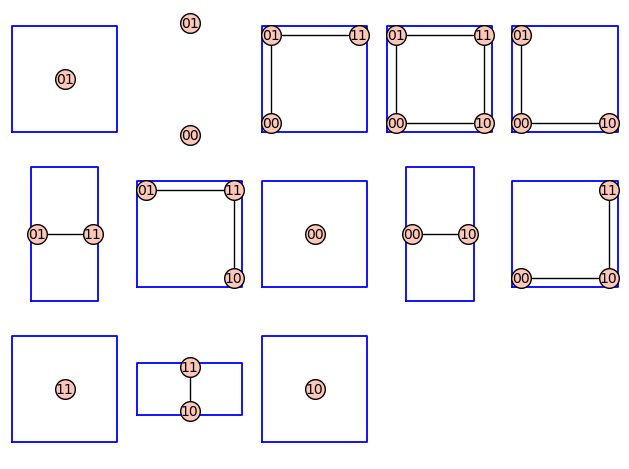
The previous images might appear confusing because they are not separated by borders. I'm not know how to uniformly add nice borders to them (which is also the question I've been wanting to ask), otherwise, it would make the above issue more clear. The following images have been processed by using Inkscape. We can clearly see that the 6th image is missing an edge.

subgraphs[5].edges(sort=true,labels=False) # output: [('00', '01')]

image description

edit retag flag offensive close merge delete

2 Answers

Sort by ยป oldest newest most voted
1

answered 2023-07-04 17:57:55 +0200

slelievre gravatar image

One workaround is to add a frame by hand to each graph plot.

Here is one way to do that.

corners = [(-0.5, -0.5), (1.5, -0.5), (1.5, 1.5), (-0.5, 1.5)]
frame = polygon2d(corners, fill=False)
g = graphs.CubeGraph(2)
subgraphs = list(g.connected_subgraph_iterator())
G = graphics_array([[frame + v.plot() for v in subgraphs]], 3, 5)
G.show(axes=False, frame=False, figsize=(8, 5))

Connected subgraphs of the 2d cube graph

edit flag offensive delete link more

Comments

1

I note that in this context, the (00, 10) edge is plotted. This hint that the problem may reside in the computation of the width of the graph...

Emmanuel Charpentier gravatar imageEmmanuel Charpentier ( 2023-07-04 19:31:16 +0200 )edit
1

answered 2023-07-04 16:27:11 +0200

Emmanuel Charpentier gravatar image

updated 2023-07-05 21:09:26 +0200

NOTE : Not an answer,, but I needed to show a graph, which is not possible in a comment.

sage: G=graphics_array(list(map(lambda u:u.plot(graph_border=True), 
                                                 graphs.CubeGraph(2).connected_subgraph_iterator())),
                                    3, 5)
sage: G
Launched png viewer for Graphics Array of size 3 x 5

displays :

image description

One notes that the borders are "tight" ; this may be parameter-dependent (you'll have to look at the general plot parameters...).

One notes that the (00, 01) subgraph has neither visible edge nor border.

The following (intentional) blunder offers a hint :

sage: G=graphics_array(list(map(lambda u:u.plot(frame=True), graphs.CubeGraph(2).connected_subgraph_iterator())), 3, 5)
sage: G
Launched png viewer for Graphics Array of size 3 x 5

image description(http://)

The suspicious supgraph has no width (whereas (01, 11) and (00, 10) have a non-zero height and (10, 11) has a width).

This smells of a bug in the .plot method (or possibly in the creation of the graph.CubeGraph layout). Would you mind explore it a bit and file an issue ?

EDIT :

sage: g=graphs.CubeGraph(2)
sage: gs=[u for u in g.connected_subgraph_iterator()]
sage: gs[11].get_pos()
{'11': (1.0, 1.0), '10': (1.0, 0.0)} # Plots okay
sage: gs[1].get_pos()
{'01': (6.123233995736766e-17, 1.0), '00': (0.0, 0.0)} # plots without width nor edge

the x coordinate of 01 is highly suspicious...

EDIT 2: I can confirm that the numerical value of the vertices positions is implied in the mechanism (pathogeny :-)) of this bug.

This is now issue #35905.

HTH,

edit flag offensive delete link more

Comments

I have asked this question before, although it is not directly related to this problem (may be the problem of tight borders). The reason behind it is not entirely clear to me. It seems to be an issue with plot, as you mentioned.

licheng gravatar imagelicheng ( 2023-07-04 16:37:24 +0200 )edit

Your Answer

Please start posting anonymously - your entry will be published after you log in or create a new account.

Add Answer

Question Tools

1 follower

Stats

Asked: 2023-07-04 14:03:04 +0200

Seen: 120 times

Last updated: Jul 05 '23