Revision history [back]
| | 1 | initial version |
NOTE : Not an answer,, but I needed to show a graph, which is not possible in a comment.
sage: G=graphics_array(list(map(lambda u:u.plot(graph_border=True),
                                                 graphs.CubeGraph(2).connected_subgraph_iterator())),
                                    3, 5)
sage: G
Launched png viewer for Graphics Array of size 3 x 5
displays :
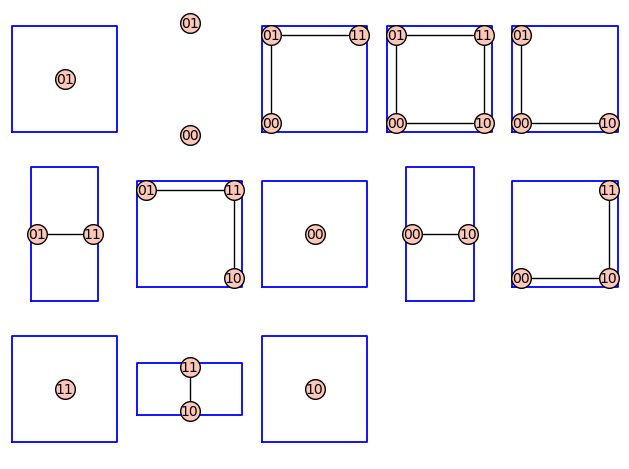
One notes that the borders are "tight" ; this may be parameter-dependent (you'll have to look at the general plot parameters...).
One notes that the (00, 01) subgraph has neither visible edge nor border.
The following (intentional) blunder offers a hint :
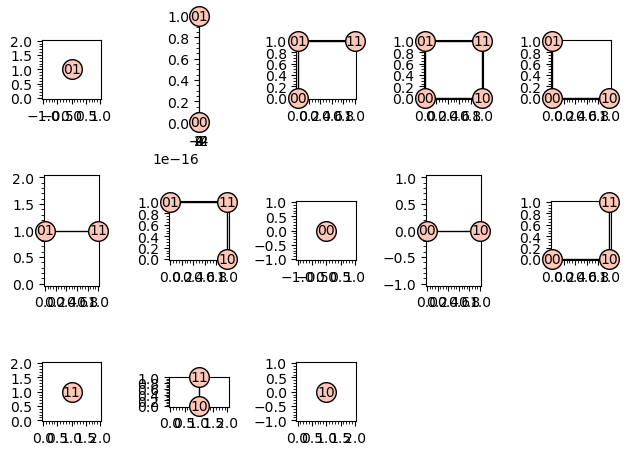
sage: G=graphics_array(list(map(lambda u:u.plot(frame=True), graphs.CubeGraph(2).connected_subgraph_iterator())), 3, 5) sage: G Launched png viewer for Graphics Array of size 3 x 5
 (http://)
The suspicious supgraph has no width (whereas (01, 11) and (00, 10) have a non-zero height and (10, 11) has a width).
This smells of a bug in the .plot method. Would you mind explore it a bit and file an issue ?
| | 2 | No.2 Revision |
NOTE : Not an answer,, but I needed to show a graph, which is not possible in a comment.
sage: G=graphics_array(list(map(lambda u:u.plot(graph_border=True),
                                                 graphs.CubeGraph(2).connected_subgraph_iterator())),
                                    3, 5)
sage: G
Launched png viewer for Graphics Array of size 3 x 5
displays :
One notes that the borders are "tight" ; this may be parameter-dependent (you'll have to look at the general plot parameters...).
One notes that the (00, 01) subgraph has neither visible edge nor border.
The following (intentional) blunder offers a hint :
(http://)
The suspicious supgraph has no width (whereas (01, 11) and (00, 10) have a non-zero height and (10, 11) has a width).
This smells of a bug in the .plot method. method (or possibly in the creation of the graph.CubeGraph layout). Would you mind explore it a bit and file an issue ?
| | 3 | No.3 Revision |
NOTE : Not an answer,, but I needed to show a graph, which is not possible in a comment.
sage: G=graphics_array(list(map(lambda u:u.plot(graph_border=True),
                                                 graphs.CubeGraph(2).connected_subgraph_iterator())),
                                    3, 5)
sage: G
Launched png viewer for Graphics Array of size 3 x 5
displays :
One notes that the borders are "tight" ; this may be parameter-dependent (you'll have to look at the general plot parameters...).
One notes that the (00, 01) subgraph has neither visible edge nor border.
The following (intentional) blunder offers a hint :
sage: G=graphics_array(list(map(lambda u:u.plot(frame=True), graphs.CubeGraph(2).connected_subgraph_iterator())), 3, 5)
sage: G
Launched png viewer for Graphics Array of size 3 x 5
(http://)
The suspicious supgraph has no width (whereas (01, 11) and (00, 10) have a non-zero height and (10, 11) has a width).
This smells of a bug in the .plot method (or possibly in the creation of the graph.CubeGraph layout). Would you mind explore it a bit and file an issue ?
EDIT :
sage: g=graphs.CubeGraph(2)
sage: gs=[u for u in g.connected_subgraph_iterator()]
sage: gs[11].get_pos()
{'11': (1.0, 1.0), '10': (1.0, 0.0)} # Plots okay
sage: gs[1].get_pos()
{'01': (6.123233995736766e-17, 1.0), '00': (0.0, 0.0)} # plots without width nor edge
the x coordinate of 01 is highly suspicious...
| | 4 | No.4 Revision |
NOTE : Not an answer,, but I needed to show a graph, which is not possible in a comment.
sage: G=graphics_array(list(map(lambda u:u.plot(graph_border=True),
                                                 graphs.CubeGraph(2).connected_subgraph_iterator())),
                                    3, 5)
sage: G
Launched png viewer for Graphics Array of size 3 x 5
displays :
One notes that the borders are "tight" ; this may be parameter-dependent (you'll have to look at the general plot parameters...).
One notes that the (00, 01) subgraph has neither visible edge nor border.
The following (intentional) blunder offers a hint :
sage: G=graphics_array(list(map(lambda u:u.plot(frame=True), graphs.CubeGraph(2).connected_subgraph_iterator())), 3, 5)
sage: G
Launched png viewer for Graphics Array of size 3 x 5
(http://)
The suspicious supgraph has no width (whereas (01, 11) and (00, 10) have a non-zero height and (10, 11) has a width).
This smells of a bug in the .plot method (or possibly in the creation of the graph.CubeGraph layout). Would you mind explore it a bit and file an issue ?
EDIT :
sage: g=graphs.CubeGraph(2)
sage: gs=[u for u in g.connected_subgraph_iterator()]
sage: gs[11].get_pos()
{'11': (1.0, 1.0), '10': (1.0, 0.0)} # Plots okay
sage: gs[1].get_pos()
{'01': (6.123233995736766e-17, 1.0), '00': (0.0, 0.0)} # plots without width nor edge
the x coordinate of 01 is highly suspicious...
EDIT 2: I can confirm that the numerical value of the vertices positions is implied in the mechanism (pathogeny :-)) of this bug.
This is now issue #35905.
HTH,
