Revision history [back]
| | 1 | initial version |
One workaround is to add a frame by hand to each graph plot.
Here is one way to do that.
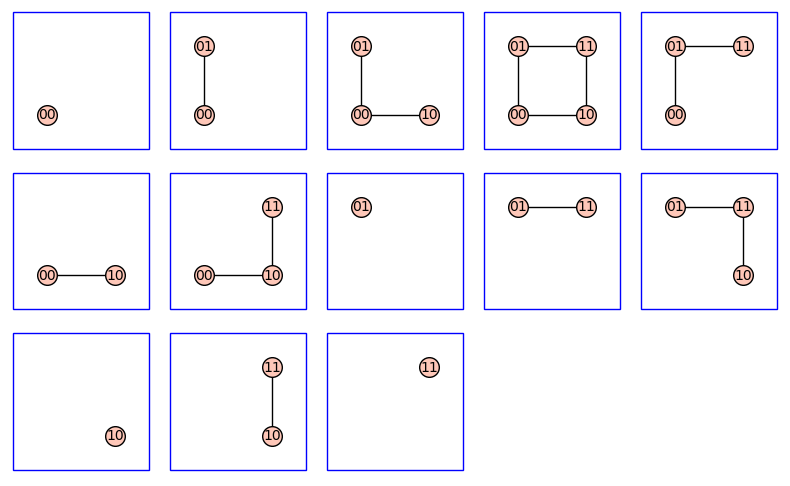
corners = [(-0.5, -0.5), (1.5, -0.5), (1.5, 1.5), (-0.5, 1.5)]
frame = polygon2d(corners, fill=False)
g = graphs.CubeGraph(2)
subgraphs = list(g.connected_subgraph_iterator())
G = graphics_array([[frame + v.plot() for v in subgraphs]], 3, 5)
G.show(axes=False, frame=False, figsize=(8, 5))