StreamPlot error "ndim" is not an attribute
import numpy as np import matplotlib.pyplot as plt import math as Math
Q = 1 #Columb
E0 = 8.854187817e-12
K = 1/ (4 * Math.pi * E0)
gridx = np.arange(-5,5,0.1)
gridy = np.arange(-5,5,0.1)
x,y = np.meshgrid (gridx, gridy)
eqn(x,y) = K*Q / (x**2 + y**2)^(1/2)
grad = vector ( [ diff(eqn,x), diff(eqn,y) ] )
Ex = diff (eqn, x)
Ey = diff (eqn, y)
U = (K*Q * x) / (x**2 + y**2)^(3/2)
V = (K*Q * y) / (x**2 + y**2)^(3/2)
plt.figure (figsize = (10, 10))
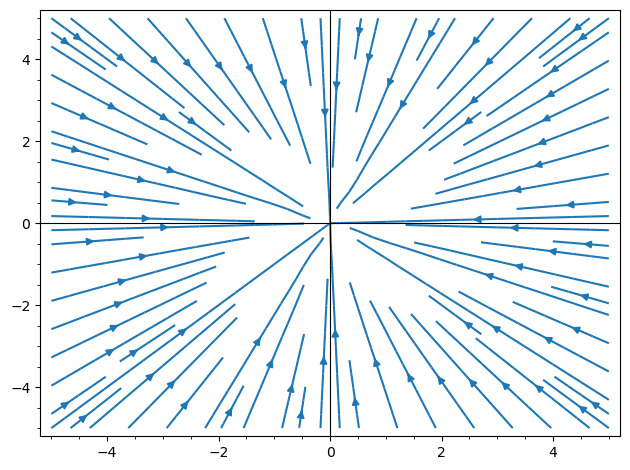
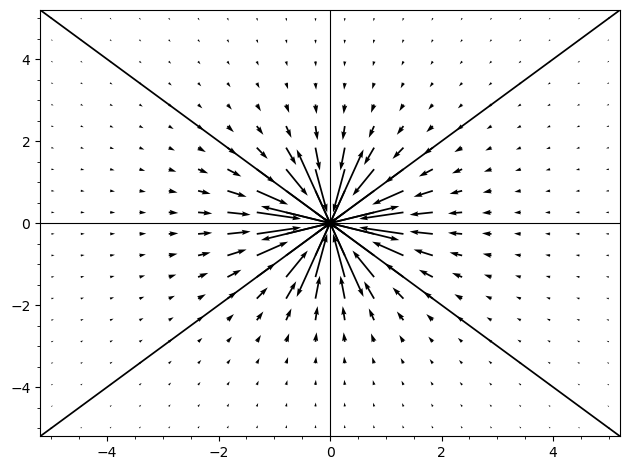
plt.streamplot (grad, x,y, color='green')
plt.streamplot (x,y, Ex,Ey, color='green')
plt.streamplot (x,y, U,V, color='green')
plt.grid()
plt.show()
Each version produces a different error, I don't understand why. And, I want to know why!
#1 .. missing required positional argument v
#2 .. ndim is not an attribute
add a comment