How to adjust the size of graphs in `graphs_list.show_graphs`
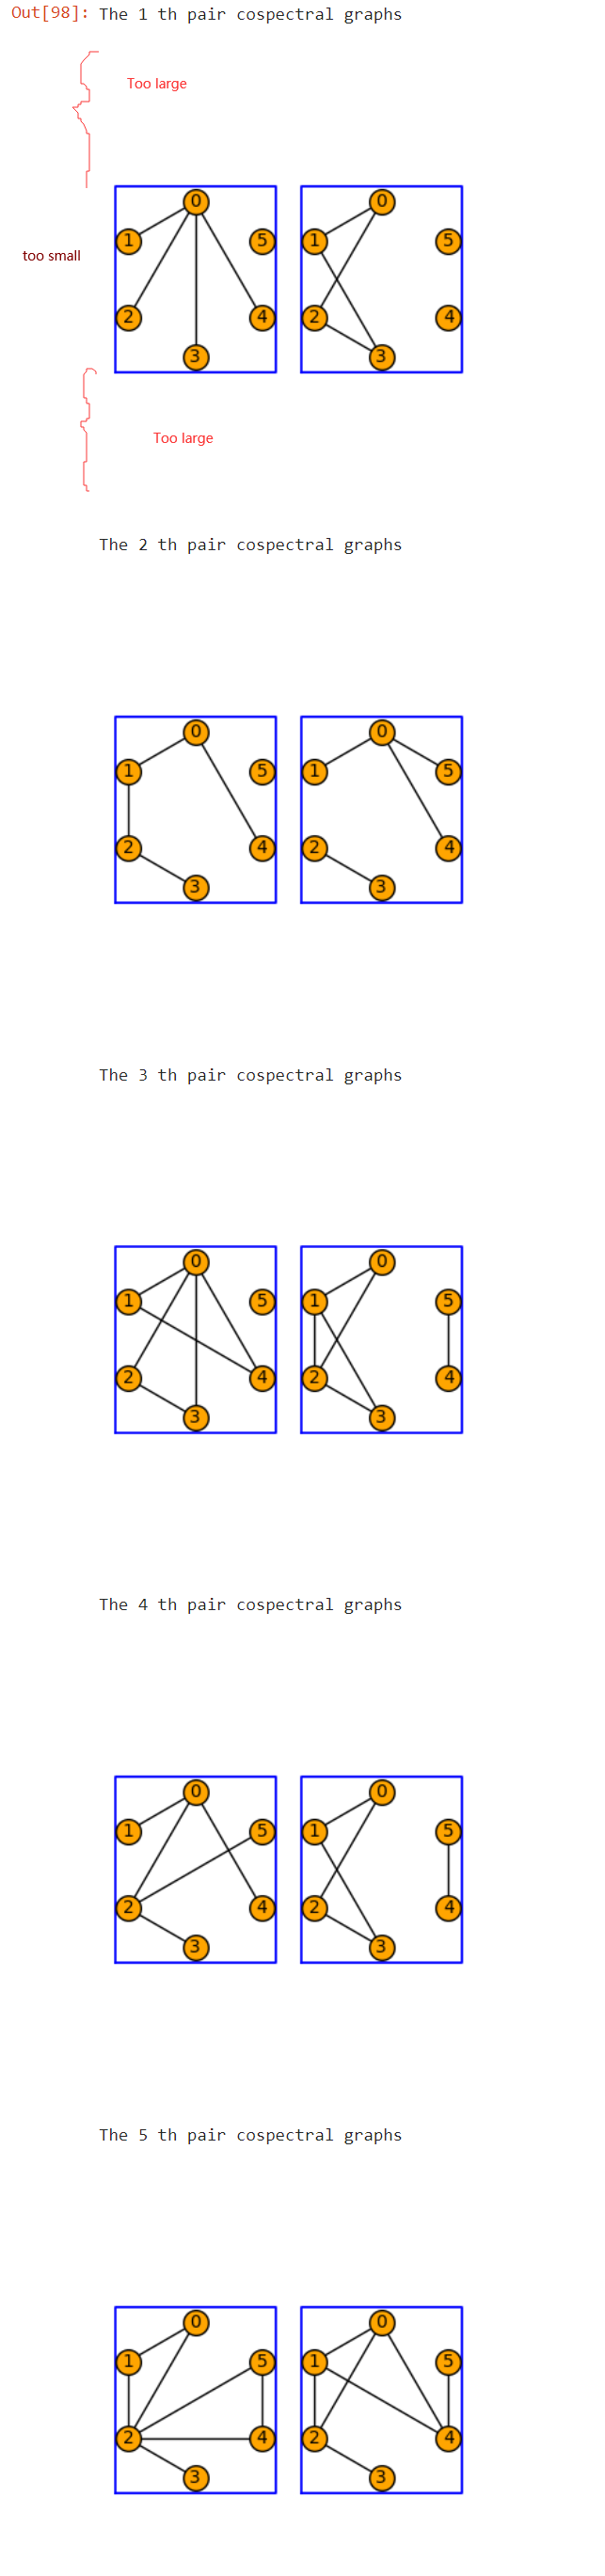
The following code is used to find some cospectral graphs. I want to show it in pairs with a for-loop. But each line of the graphs looks too small and there is too much space between each pair of graphs. I want to show them in a beautiful way.
g=graphs.cospectral_graphs(6)
l=len(g)
for i in range(l):
    print("The",i+1, "th pair cospectral graphs")
    graphs_list.show_graphs(g[i],vertex_size=200,figsize=100,vertex_labels=True,vertex_color='orange')
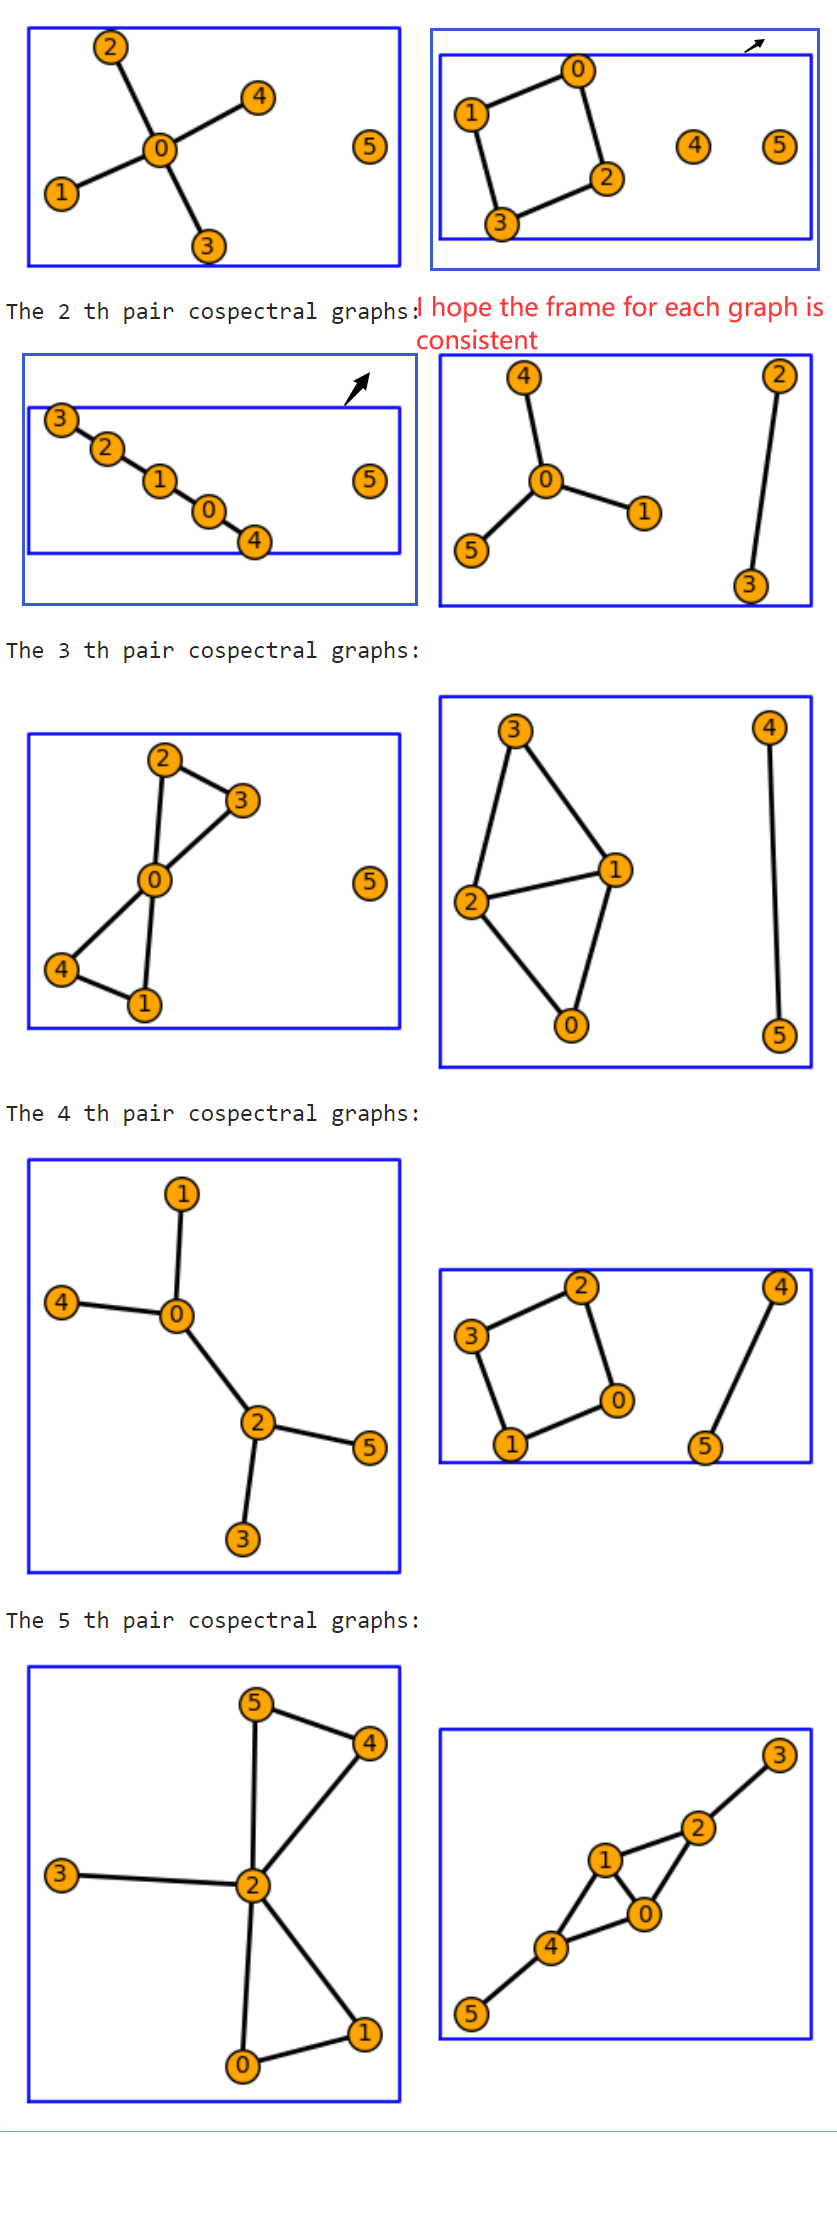
I tried another method. I put a frame around each graph (like the blue border above). But the frame for each graph is not is inconsistent (see in the following picture). (The reason for putting a frame around each graph is to better distinguish the different graphs)
g=graphs.cospectral_graphs(6)
l=len(g)
for i in range(l):
    G=[plot(g[i][j],graph_border=True,edge_thickness=2, vertex_size=200,vertex_labels=True,vertex_color='orange') for j in range(len(g[i]))]
    print("The",i+1, "th pair cospectral graphs:")
    graphics_array(G).show(figsize=5)

This question relates to the presentation of the result computed by Sage, and depends on the interface you are using. Therefore, you should aim your question :
to a Jupyter forum/mailing list if you use the Jupyter notebook
to a LaTeX forum/mailing list if you aim to produce a PDF
etc...
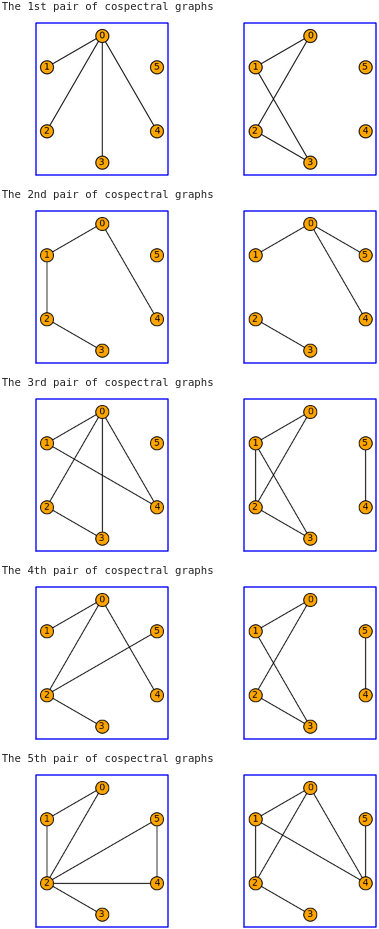
You may also work along the lines of
graphics_array([[v.plot() for v in u] for u in graphs.cospectral_graphs(6)])which leaves you entirely responsible for the formatting...HTH