Revision history [back]
| | 1 | initial version |
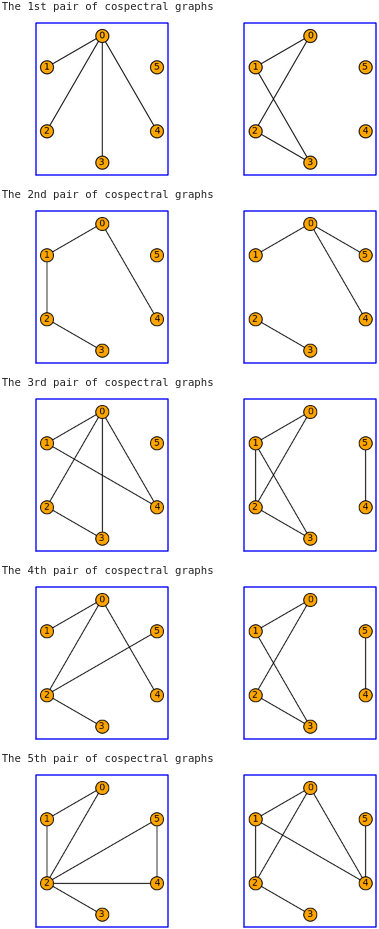
Not sure how to customize the graphics produced by graphs_list.show_graphs.
As you figured out, an alternative approach is to
- use
graphics_array - specify some options to the
plotmethod of each graph
Here are some options that will hopefully work for you.
G = graphs.cospectral_graphs(6)
opt = dict(vertex_size=200, vertex_labels=True, vertex_color='orange',
           graph_border=True, layout='circular', xmin=-1.5, xmax=1.5)
n_st = {1: 'st', 2: 'nd', 3: 'rd'}
n_th = lambda n: n_st[n % 10] if n % 10 in (1, 2, 3) and (n % 100) // 10  - 1 else 'th'
nth = lambda n: f'{n}{n_th(n)}'
for n, gg in enumerate(G, start=1):
    print(f"The {nth(n)} pair of cospectral graphs")
    graphics_array([g.plot(**opt) for g in gg]).show()