How can we label 3d cube?
If we use cube() function we get a nice cube without vertices labelled. I could not find any inbuilt method to label vertices. Is there any way to do this?
add a comment
Yes, you can use text3d. The following code may give you some ideas:
v_opt = dict(fontsize="200%", fontfamily="palatino", fontstyle="italic", color="blue")
f_opt = dict(fontsize="200%", fontfamily="palatino", fontstyle="italic", color="black")

fig = cube(center=(0.5,0.5,0.5), size=1, color="lightgreen", frame_thickness=2,
           frame_color="red", opacity=0.8)
fig += (text3d("A", (1.02,0,0), **v_opt) + text3d("B", (1.02,1.02,0), **v_opt)
        + text3d("C", (1.02,1.02,1.02), **v_opt) + text3d("D", (1.02,0,1.02), **v_opt)
        + text3d("E", (-0.02,0,0), **v_opt) + text3d("F", (-0.02,1.02,0), **v_opt)
        + text3d("G", (-0.02,1.02,1.02), **v_opt) + text3d("H", (-0.02,0,1.02), **v_opt))
fig += (text3d("front", (1.05,0.5,0.5),**f_opt) + text3d("back", (-0.05,0.5,0.5),**f_opt)
        + text3d("left", (0.5,-0.05,0.5),**f_opt) + text3d("right", (0.5,1.05,0.5),**f_opt)
        + text3d("up", (0.5,0.5,1.05),**f_opt) + text3d("down", (0.5,0.5,-0.05),**f_opt))
show(fig, frame=False)
This is the result, that you can also see in SageCell:
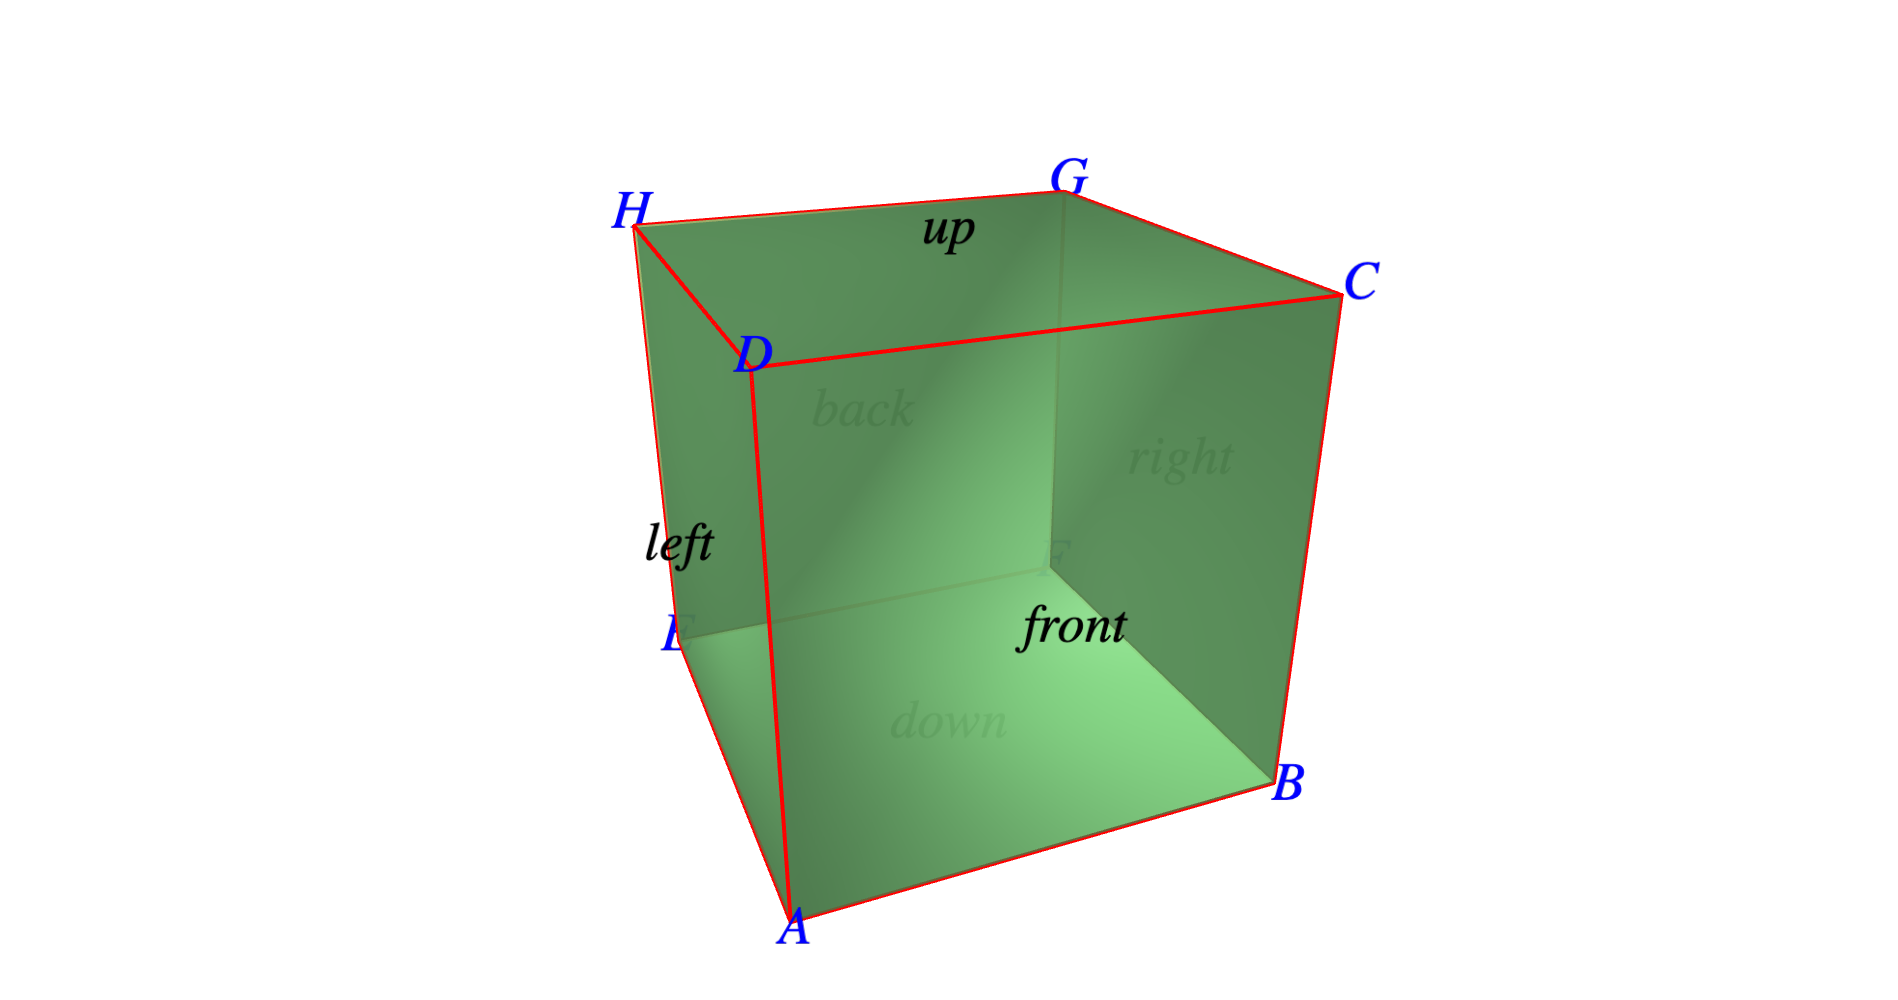
Use threejs_flat_shading to get a more appropriate shading:
fig = cube(center=(0.5,0.5,0.5), size=1, color="lightgreen", frame_thickness=2,
       frame_color="red", opacity=0.8, threejs_flat_shading=True)
One would have hoped that problem to be over with Sage Trac ticket 31426 merged in Sage 9.6.beta4. Seems we need a follow-up ticket.
Two graphs are related:
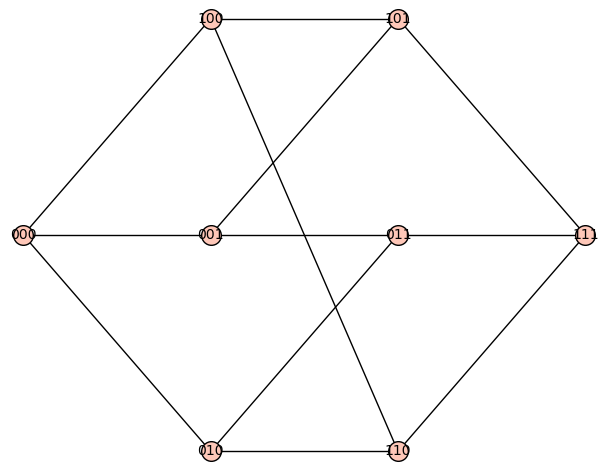
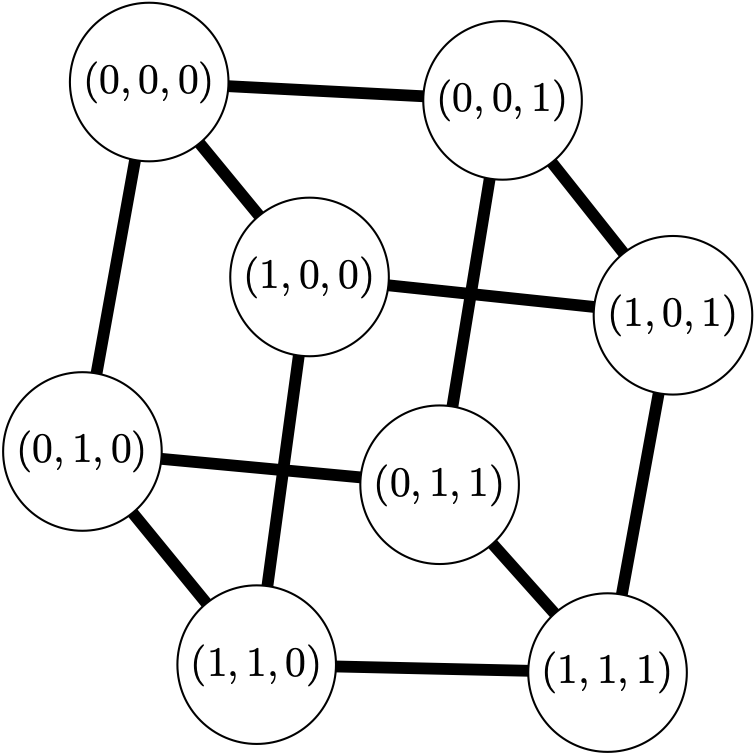
graphs.CubeGraph(3)graphs.GridGraph([2, 2, 2])Their 2d plots and latexed forms have labels, but the 3d plots do not.
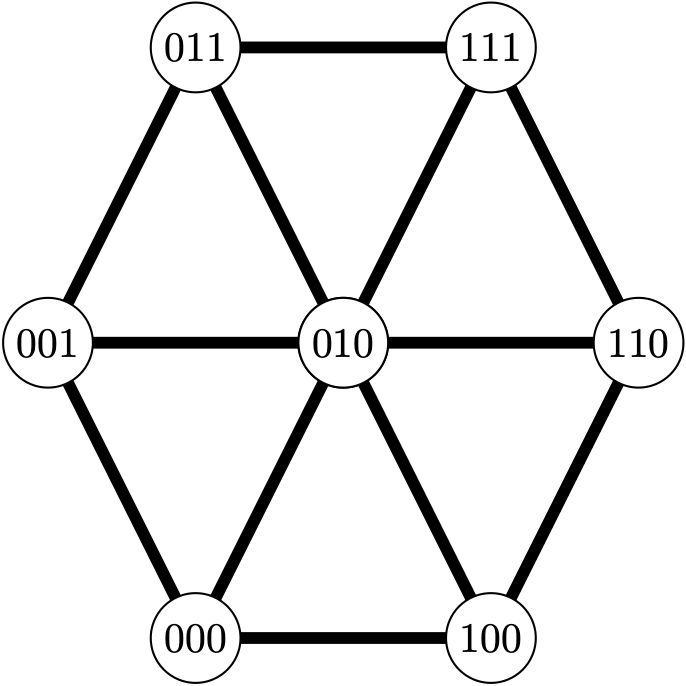
Define the cube graph
sage: C = graphs.CubeGraph(3)
sage: C
3-Cube: Graph on 8 vertices
Check its 2d plot, latex view, and 3d plot:
sage: C.plot()
sage: view(C)
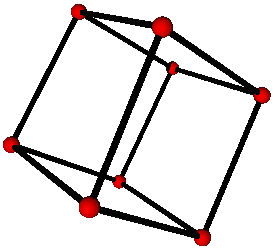
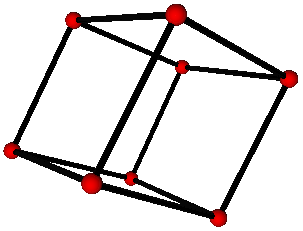
sage: C.plot3d()
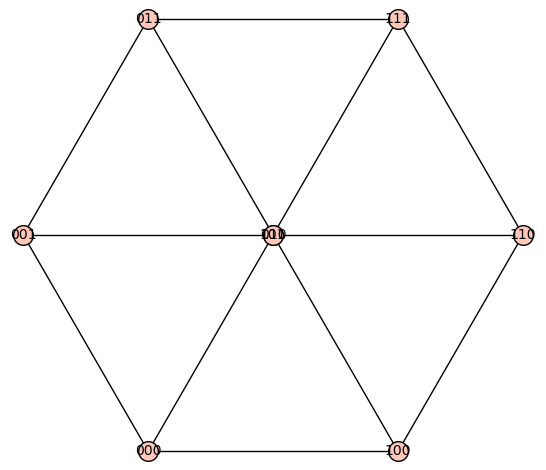
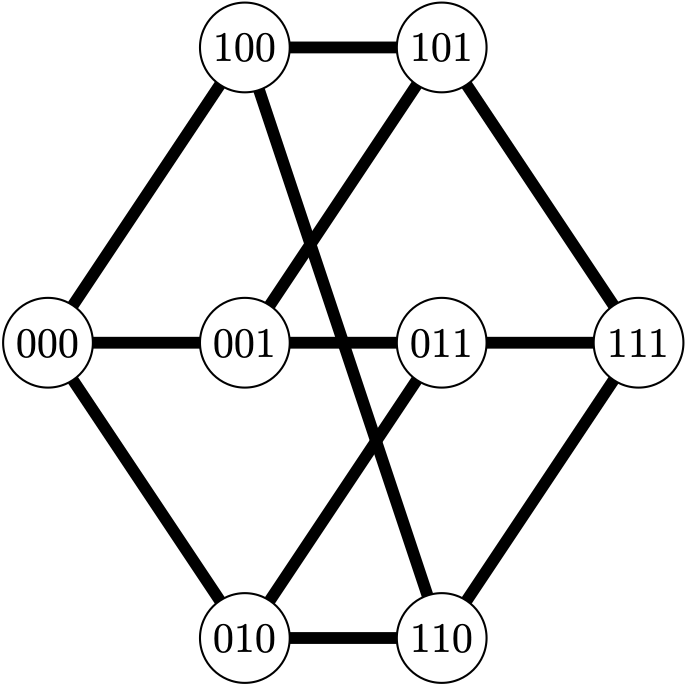
There is an option to get a different embedding:
sage: D = graphs.CubeGraph(3, embedding=2)
sage: D
3-Cube: Graph on 8 vertices
Check its 2d plot, latex view, and 3d plot:
sage: D.plot()
sage: view(D)
sage: D.plot3d()
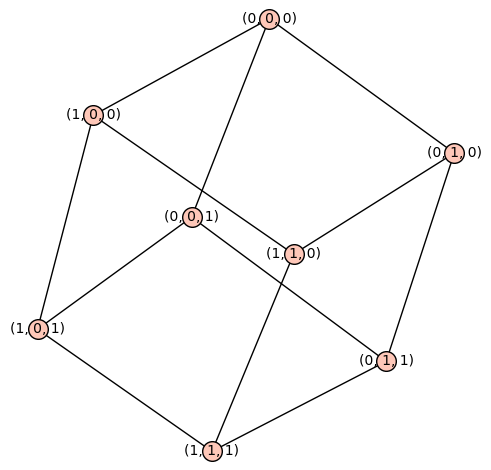
The grid graph displays better:
sage: G = graphs.GridGraph([2, 2, 2])
sage: G
Grid Graph for [2, 2, 2]: Graph on 8 vertices

sage: G.plot()
Launched png viewer for Graphics object consisting of 21 graphics primitives
sage: view(G)
sage: G.plot3d()
Launched html viewer for Graphics3d Object
Asked: 2022-06-27 16:36:05 +0200
Seen: 789 times
Last updated: Jun 28 '22
 Copyright Sage, 2010. Some rights reserved under creative commons license. Content on this site is licensed under a Creative Commons Attribution Share Alike 3.0 license.
