Revision history [back]
| | 1 | initial version |
Two graphs are related:
graphs.CubeGraph(3)graphs.GridGraph([2, 2, 2])
Their 2d plots and latexed forms have labels, but the 3d plots do not.
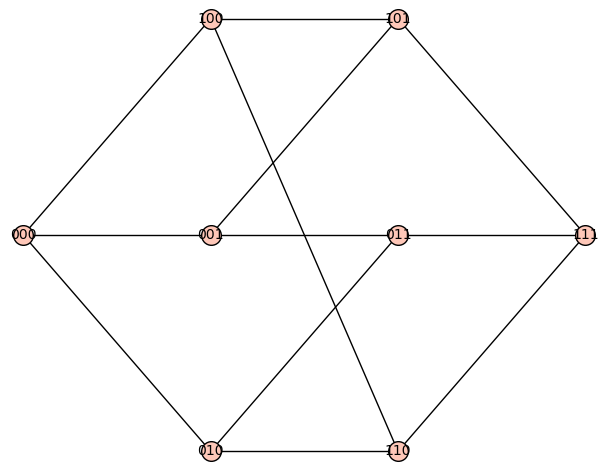
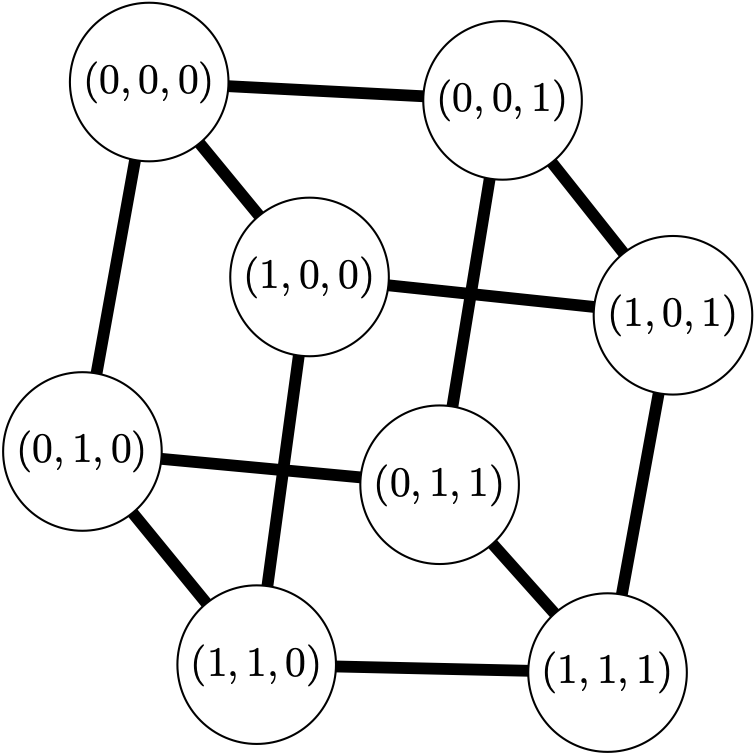
Cube graph
Define the cube graph
sage: C = graphs.CubeGraph(3)
sage: C
3-Cube: Graph on 8 vertices
Check its 2d plot, latex view, and 3d plot:
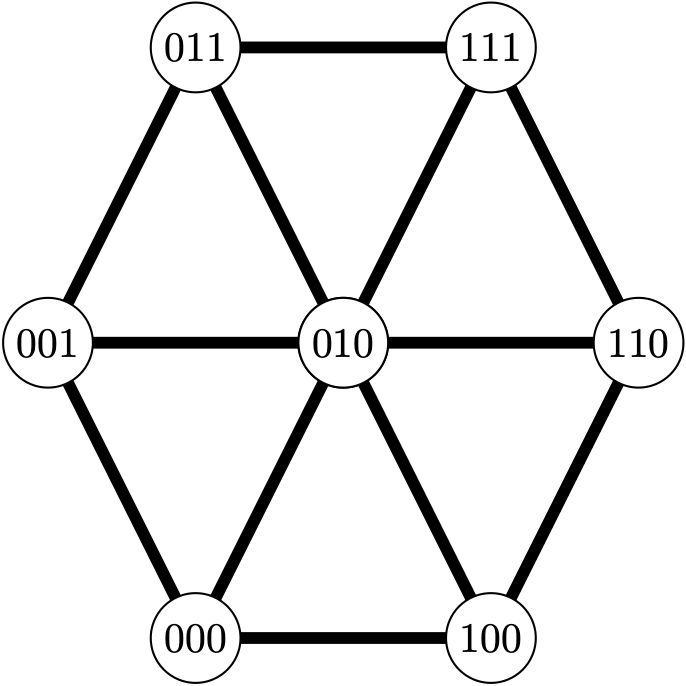
sage: C.plot()
sage: view(C)
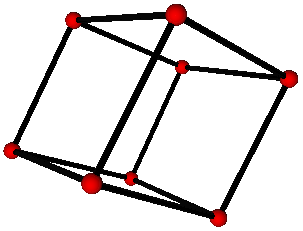
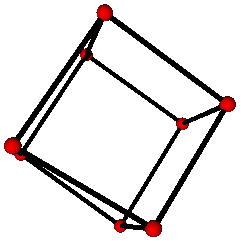
sage: C.plot3d()
There is an option to get a different embedding:
sage: D = graphs.CubeGraph(3, embedding=2)
sage: D
3-Cube: Graph on 8 vertices
Check its 2d plot, latex view, and 3d plot:
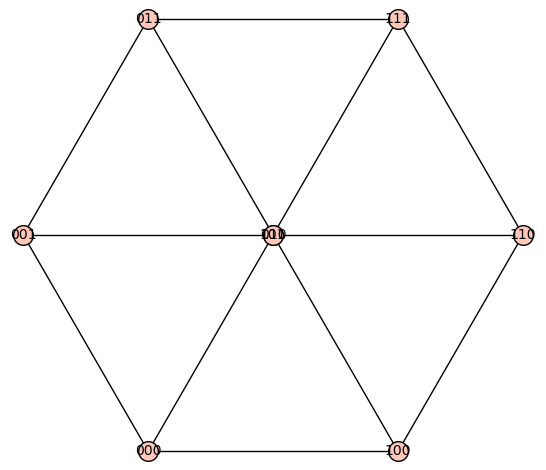
sage: D.plot()
sage: view(D)
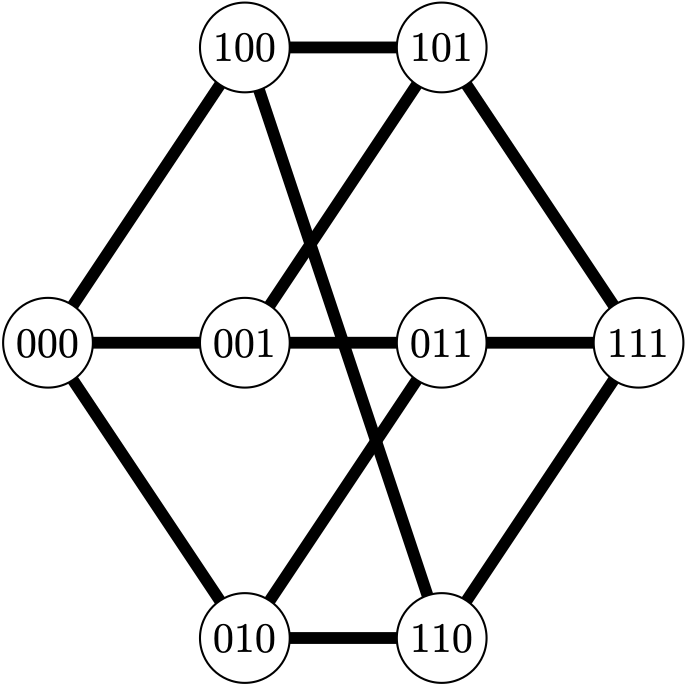
sage: D.plot3d()
Grid graph
The grid graph displays better:
sage: G = graphs.GridGraph([2, 2, 2])
sage: G
Grid Graph for [2, 2, 2]: Graph on 8 vertices

sage: G.plot()
Launched png viewer for Graphics object consisting of 21 graphics primitives
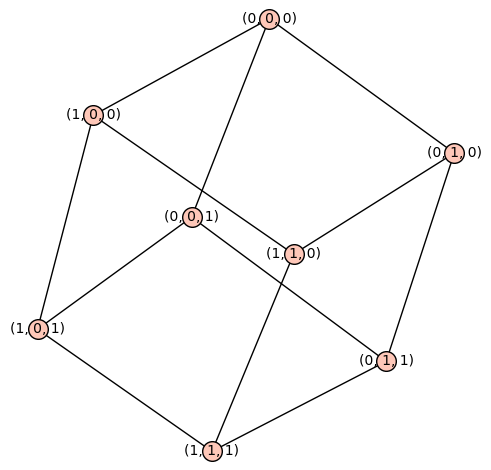
sage: view(G)
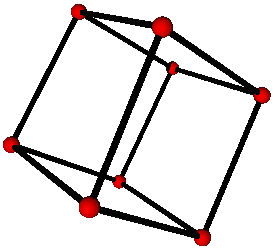
sage: G.plot3d()
Launched html viewer for Graphics3d Object