Revision history [back]
| | 1 | initial version |

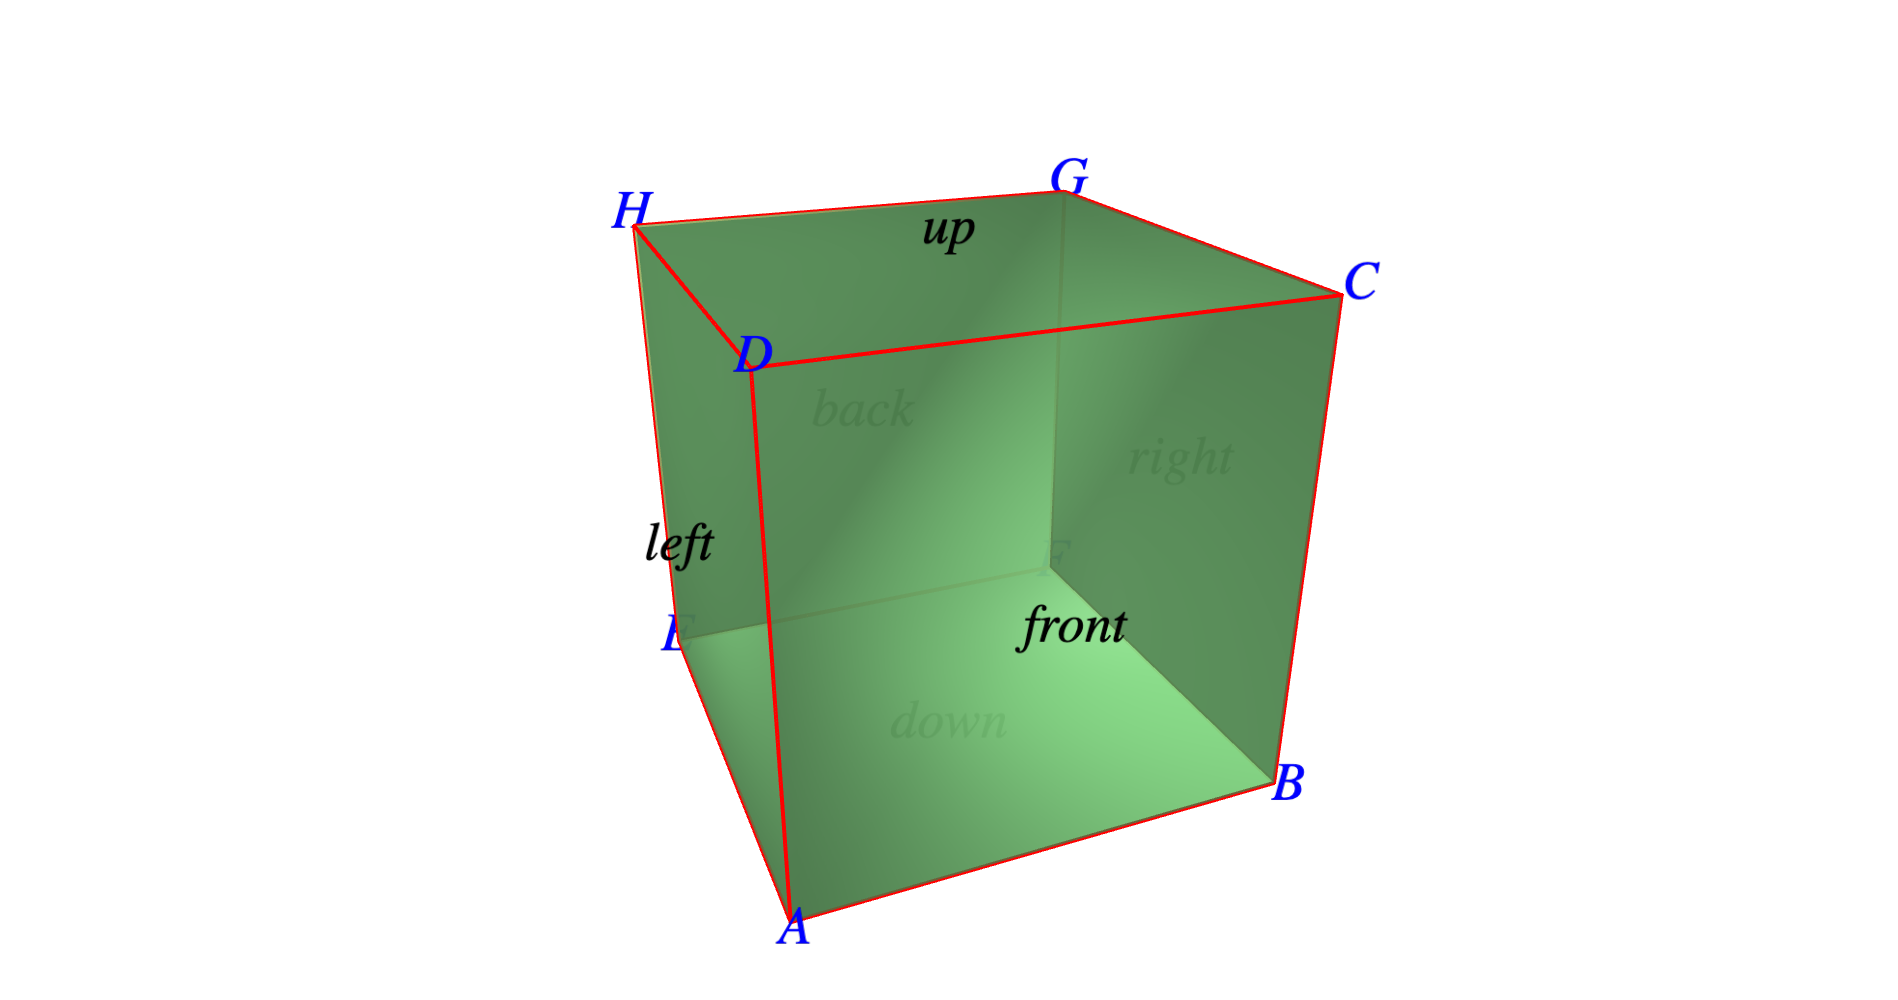
Yes, you can use text3d. The following code may give you some ideas:
v_opt = dict(fontsize="200%", fontfamily="palatino", fontstyle="italic", color="blue")
f_opt = dict(fontsize="200%", fontfamily="palatino", fontstyle="italic", color="black")

fig = cube(center=(0.5,0.5,0.5), size=1, color="lightgreen", frame_thickness=2,
           frame_color="red", opacity=0.8)
fig += (text3d("A", (1.02,0,0), **v_opt) + text3d("B", (1.02,1.02,0), **v_opt)
        + text3d("C", (1.02,1.02,1.02), **v_opt) + text3d("D", (1.02,0,1.02), **v_opt)
        + text3d("E", (-0.02,0,0), **v_opt) + text3d("F", (-0.02,1.02,0), **v_opt)
        + text3d("G", (-0.02,1.02,1.02), **v_opt) + text3d("H", (-0.02,0,1.02), **v_opt))
fig += (text3d("front", (1.05,0.5,0.5),**f_opt) + text3d("back", (-0.05,0.5,0.5),**f_opt)
        + text3d("left", (0.5,-0.05,0.5),**f_opt) + text3d("right", (0.5,1.05,0.5),**f_opt)
        + text3d("up", (0.5,0.5,1.05),**f_opt) + text3d("down", (0.5,0.5,-0.05),**f_opt))
show(fig, frame=False)
This is the result, that you can also see in SageCell: