Ask Your Question
0

TeX label and running list-variable simultaneously in a plot legend (or plot title)

asked 2022-02-15 16:15:27 +0200

c.p. gravatar image

updated 2022-02-15 17:50:14 +0200

I want to use a [... for n in ...] to generate plots. How can I combine in a legend and/or title, TeX with the variable that runs (here $n$) to generate the list of plots? Minimal example:

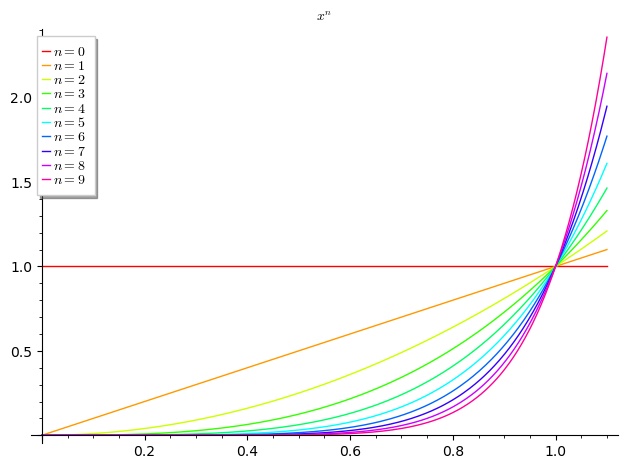
some_plots=[plot(x^n,(x,0,1.1),title=r'$x^n$ where $n$ takes the value in the box 
                 (format is not nice, though)', 
                 legend_label=n, rgbcolor=hue(.1*n)) for n in range(0,10)] 
sum(some_plots[s] for s in range(0,10))

which shows a box with colors, and, separately the title. How can I add $n$ to the box? If I combine TeX and the variable (like $x^n$=n) I get errors. (I cannot upload yet pictures, which would make the question very clear)

edit retag flag offensive close merge delete

1 Answer

Sort by ยป oldest newest most voted
1

answered 2022-02-15 19:57:25 +0200

Emmanuel Charpentier gravatar image

Is this :

sage: some_plots=[plot(x^u, (0,1.1), title=r"$x^n$", legend_label="$n=%d$"%u, rgbcolor=hue(0.1*u)) for u in range(0,10)]
sage: sum(some_plots)

Overlaid plots

what you mean (up to legend placement, which I'm too lazy to fine tune...) ?

edit flag offensive delete link more

Comments

sure, that solves it:) I didn't know about % and %d.

c.p. gravatar imagec.p. ( 2022-02-16 09:46:36 +0200 )edit

Google "string splicing" for Python abilities in this department (which are multiple...).

Emmanuel Charpentier gravatar imageEmmanuel Charpentier ( 2022-02-17 14:39:03 +0200 )edit

Your Answer

Please start posting anonymously - your entry will be published after you log in or create a new account.

Add Answer

Question Tools

1 follower

Stats

Asked: 2022-02-15 16:15:27 +0200

Seen: 169 times

Last updated: Feb 15 '22