Revision history [back]
| | 1 | initial version |
Is this :
sage: some_plots=[plot(x^u, (0,1.1), title=r"$x^n$", legend_label="$n=%d$"%u, rgbcolor=hue(0.1*u)) for u in range(0,10)]
sage: sum(some_plots)
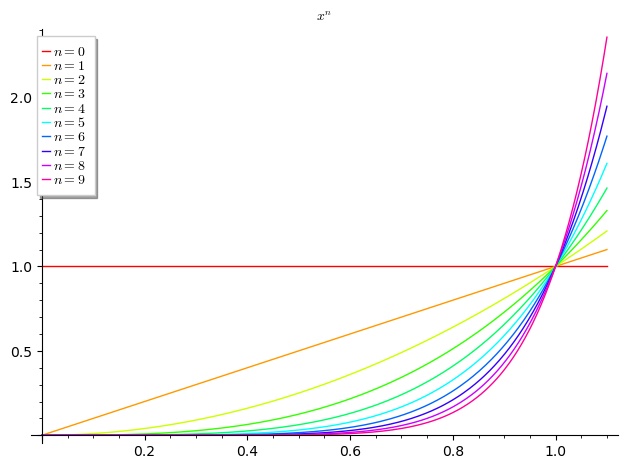
what you mean (up to legend placement, which I'm too lazy to fine tune...) ?
