Editing DiGraph layout.
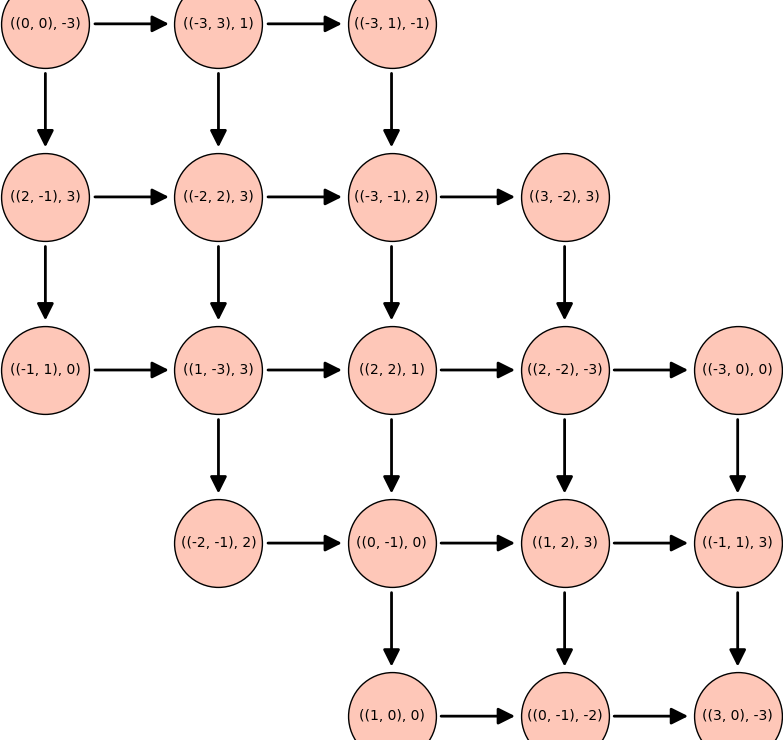
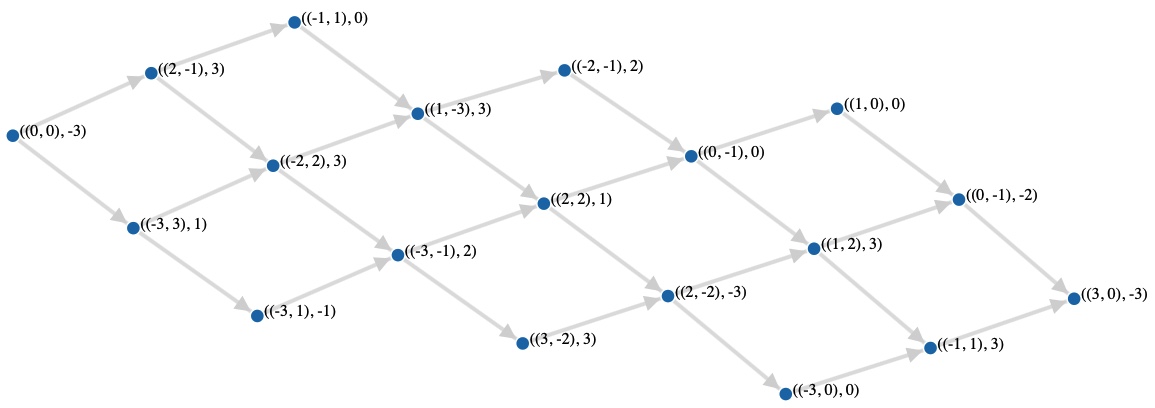
I have the following DiGraph, G, that I generated: C:\fakepath\z_tmp.png
This plot is generated by doing: G.plot()
I would like to be able to see the vertex labels more clearly on this plot.
In order to edit the DiGraph, I had tried to remove the nodes entirely and simply have the labels via the vertex_shape=None argument for graphplot(), however this seems to be unsupported for DiGraphs. I am open to other suggestions to alter this plot so that I may see labels clearly.
I am currently running Sage v8.9


maybe upgrade to 9.4 ? I do not see vertex label problem with 9.4
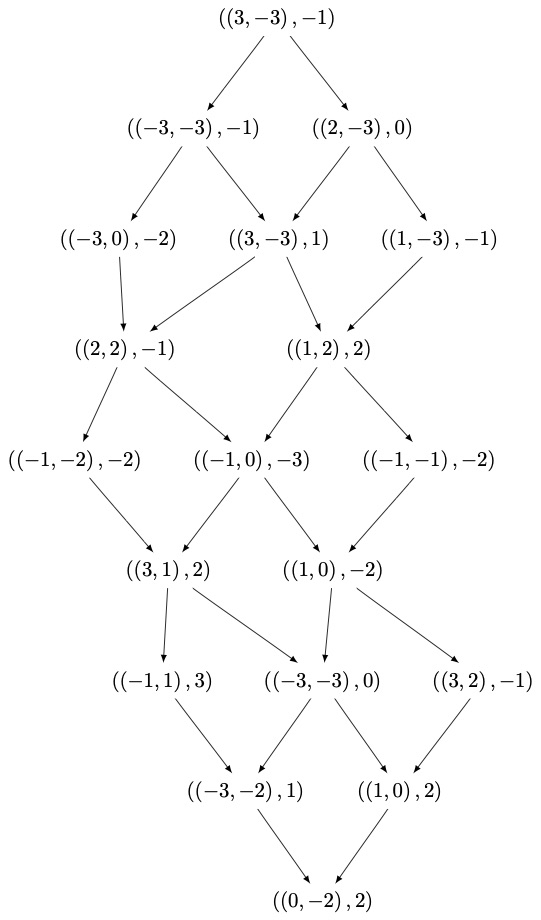
In the picture I have generated above, the issue is the labels are not simple integers but rather a tuple, for example something of the form: ((-2,2),5). These labels are covered by some arrows and also not entirely contained within the vertex nodes. I have tried to plot my DiGraph in the CoCalc lab which is version 9.4, but the result is the same as with version 8.9.
Oops ! ok sorry @Bark.