Revision history [back]
| | 1 | initial version |
Let us first get a graph similar to your example
G = graphs.Grid2dGraph(5,5)
G.delete_vertices([(4, 0), (4, 1), (3, 0), (0, 3), (0, 4), (1, 4)])
D = DiGraph([(u, v) if u < v else (v, u) for u,v in G.edges(labels=False)])
g_pos = G.get_pos()
pos = {u: g_pos[u] for u in D}
D.set_pos(pos)
perm = {u: ((randint(-3, 3), randint(-3, 3)), randint(-3, 3)) for u in D}
H = D.relabel(perm=perm, inplace=False)
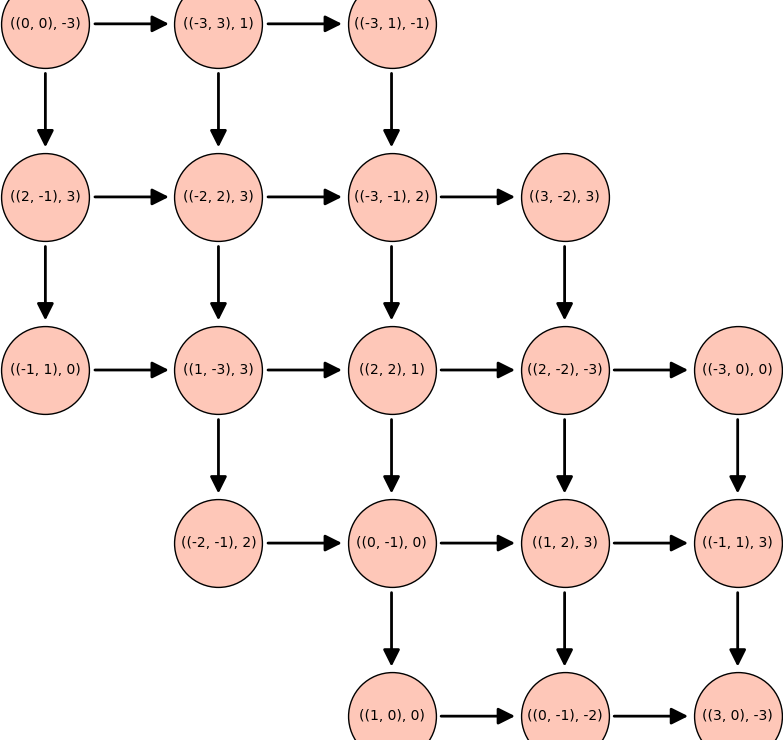
Then you can try
H.plot(vertex_size=4000, figsize=10)
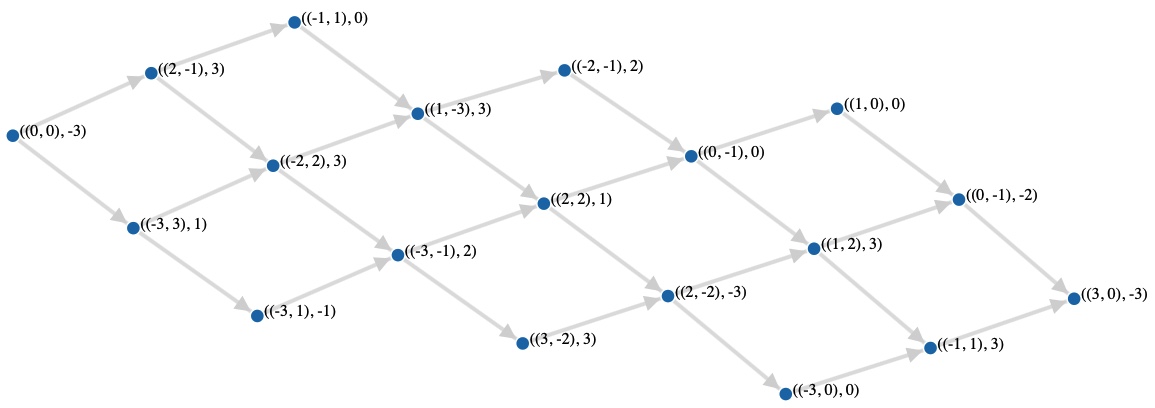
Another method is to use d3.js (see the documentation for parameters)
I = DiGraph(H.edges())
I.show(method='js', link_distance=150, gravity=0.001)
and you get something like this
| | 2 | No.2 Revision |
Let us first get a graph similar to your example
G = graphs.Grid2dGraph(5,5)
G.delete_vertices([(4, 0), (4, 1), (3, 0), (0, 3), (0, 4), (1, 4)])
D = DiGraph([(u, v) if u < v else (v, u) for u,v in G.edges(labels=False)])
g_pos = G.get_pos()
pos = {u: g_pos[u] for u in D}
D.set_pos(pos)
perm = {u: ((randint(-3, 3), randint(-3, 3)), randint(-3, 3)) for u in D}
H = D.relabel(perm=perm, inplace=False)
Then you can try
H.plot(vertex_size=4000, figsize=10)
Another method is to use d3.js (see the documentation for parameters)
I = DiGraph(H.edges())
I.show(method='js', link_distance=150, gravity=0.001)
and you get something like this
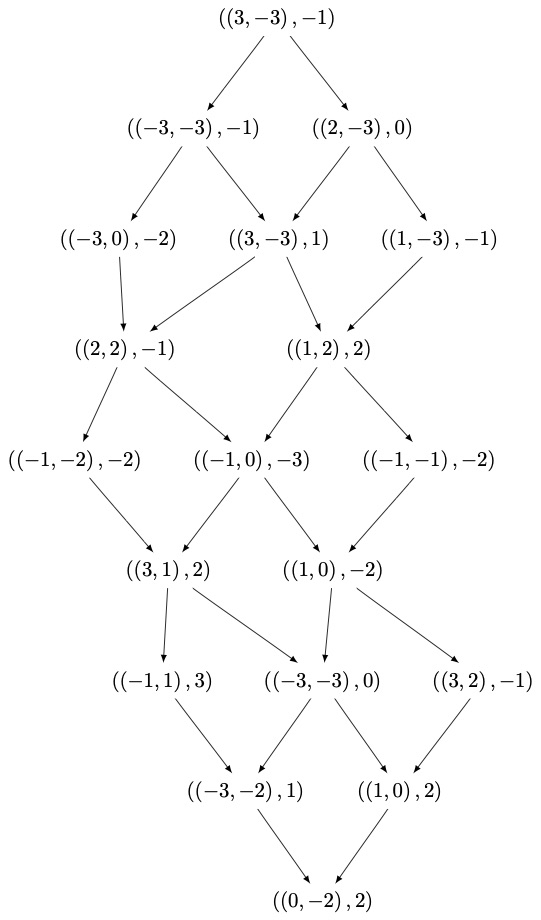
If you have dot2tex installed (see question 60815), you can also do:
I.set_latex_options(format='dot2tex')
view(I)
| | 3 | No.3 Revision |
Let us first get a graph similar to your example
G = graphs.Grid2dGraph(5,5)
G.delete_vertices([(4, 0), (4, 1), (3, 0), (0, 3), (0, 4), (1, 4)])
D = DiGraph([(u, v) if u < v else (v, u) for u,v in G.edges(labels=False)])
g_pos = G.get_pos()
pos = {u: g_pos[u] for u in D}
D.set_pos(pos)
perm = {u: ((randint(-3, 3), randint(-3, 3)), randint(-3, 3)) for u in D}
H = D.relabel(perm=perm, inplace=False)
Then you can try
H.plot(vertex_size=4000, figsize=10)
Another method is to use d3.js (see the documentation for parameters)
I = DiGraph(H.edges())
I.show(method='js', link_distance=150, gravity=0.001)
and you get something like this
If you have dot2tex installed (see question 60815), you can also do:
I.set_latex_options(format='dot2tex')
view(I)
