Ask Your Question
1

Editing DiGraph layout.

asked 2022-01-22 04:55:29 +0200

Bark gravatar image

updated 2022-01-22 08:31:10 +0200

FrédéricC gravatar image

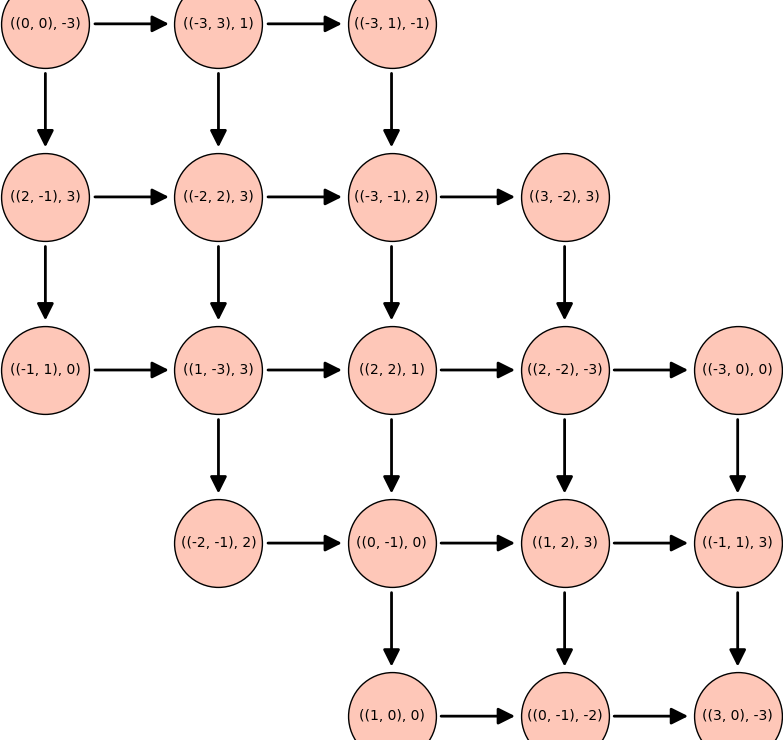
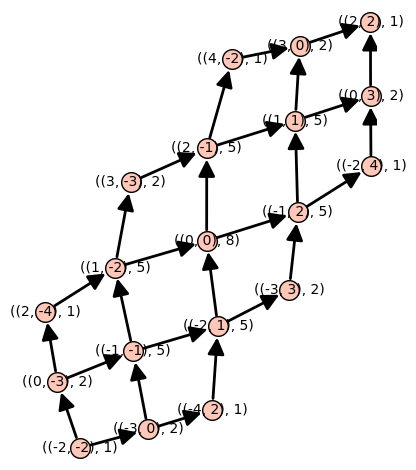
I have the following DiGraph, G, that I generated: C:\fakepath\z_tmp.png

This plot is generated by doing: G.plot()

I would like to be able to see the vertex labels more clearly on this plot.

In order to edit the DiGraph, I had tried to remove the nodes entirely and simply have the labels via the vertex_shape=None argument for graphplot(), however this seems to be unsupported for DiGraphs. I am open to other suggestions to alter this plot so that I may see labels clearly.

I am currently running Sage v8.9

edit retag flag offensive close merge delete

Comments

maybe upgrade to 9.4 ? I do not see vertex label problem with 9.4

g = DiGraph( {-2: [0, -3],-3: [-4, -1],0: [-1, 2],2: [1],-4: [-2],-1: [1, -2] }  )
show(g)
ortollj gravatar imageortollj ( 2022-01-22 06:16:48 +0200 )edit

In the picture I have generated above, the issue is the labels are not simple integers but rather a tuple, for example something of the form: ((-2,2),5). These labels are covered by some arrows and also not entirely contained within the vertex nodes. I have tried to plot my DiGraph in the CoCalc lab which is version 9.4, but the result is the same as with version 8.9.

Bark gravatar imageBark ( 2022-01-23 03:08:12 +0200 )edit

Oops ! ok sorry @Bark.

ortollj gravatar imageortollj ( 2022-01-23 07:30:02 +0200 )edit

1 Answer

Sort by » oldest newest most voted
3

answered 2022-01-23 11:42:43 +0200

updated 2022-01-30 11:07:04 +0200

Let us first get a graph similar to your example

G = graphs.Grid2dGraph(5,5)
G.delete_vertices([(4, 0), (4, 1), (3, 0), (0, 3), (0, 4), (1, 4)])
D = DiGraph([(u, v) if u < v else (v, u) for u,v in G.edges(labels=False)])
g_pos = G.get_pos()
pos = {u: g_pos[u] for u in D}
D.set_pos(pos)
perm = {u: ((randint(-3, 3), randint(-3, 3)), randint(-3, 3)) for u in D}
H = D.relabel(perm=perm, inplace=False)

Then you can try

H.plot(vertex_size=4000, figsize=10)

using positions, vertex size and figsize

Another method is to use d3.js (see the documentation for parameters)

I = DiGraph(H.edges())
I.show(method='js', link_distance=150, gravity=0.001)

and you get something like this

using d3.js

If you have dot2tex installed (see question 60815), you can also do:

I.set_latex_options(format='dot2tex')
view(I)

image description

edit flag offensive delete link more

Your Answer

Please start posting anonymously - your entry will be published after you log in or create a new account.

Add Answer

Question Tools

1 follower

Stats

Asked: 2022-01-22 04:55:29 +0200

Seen: 342 times

Last updated: Jan 30 '22