Ask Your Question
1

ymin and ymax not working

asked 2021-11-07 14:26:58 +0200

Sage gravatar image

updated 2021-11-13 19:20:41 +0200

slelievre gravatar image

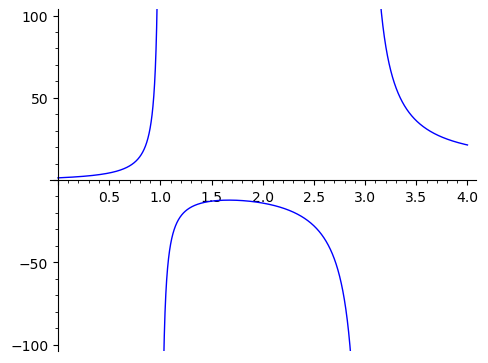
Running this code

f_x = (x**3 - x**2 + 3*x + 4) / (x**2 - 4*x + 3)
plot(f_x, (x, 0, 4), detect_poles=True, ymin=-100, ymax=100)

results in a graph with a max y of about 500000.

What am I doing wrong? The x-axis is limited, as I want, in the range 0 to 4.
edit retag flag offensive close merge delete

2 Answers

Sort by ยป oldest newest most voted
0

answered 2021-11-18 00:51:04 +0200

jakupl gravatar image

updated 2021-11-18 01:08:01 +0200

Does this work?

f_x = (x**3 - x**2 + 3*x + 4) / (x**2 - 4*x + 3)
_ = plot(f_x, (x, 0, 4), detect_poles=True)
_.show(ymin=-100, ymax=100)
edit flag offensive delete link more
2

answered 2021-11-13 19:28:45 +0200

slelievre gravatar image

Not sure what the problem might be with your installation.

It could help to know the operating system, the version of Sage, and the way it was it installed.

The output I get with Sage 9.5.beta4 built from source on macOS 10.14.6 is correct.

sage: f_x = (x**3 - x**2 + 3*x + 4) / (x**2 - 4*x + 3)
sage: plot(f_x, (x, 0, 4), detect_poles=True, ymin=-100, ymax=100)
Launched png viewer for Graphics object consisting of 3 graphics primitives

Sage plot for quotient of polynomials

Likewise on SageCell, currently running Sage 9.4.

edit flag offensive delete link more

Your Answer

Please start posting anonymously - your entry will be published after you log in or create a new account.

Add Answer

Question Tools

Stats

Asked: 2021-11-07 14:26:58 +0200

Seen: 328 times

Last updated: Nov 18 '21