ymin and ymax not working
Running this code
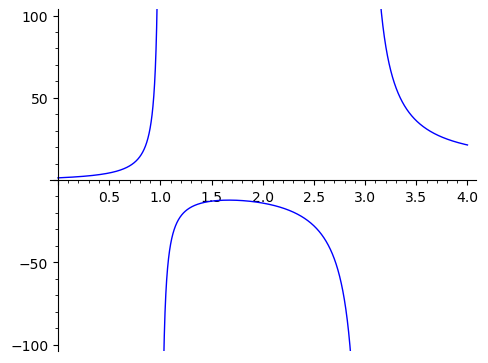
f_x = (x**3 - x**2 + 3*x + 4) / (x**2 - 4*x + 3)
plot(f_x, (x, 0, 4), detect_poles=True, ymin=-100, ymax=100)
results in a graph with a max y of about 500000.
What am I doing wrong? The x-axis is limited, as I want, in the range 0 to 4.
add a comment