Ask Your Question
1

differential equation

asked 2021-06-29 13:38:26 +0200

ErWinz gravatar image

hi

we are discovering Sagemaths and trying to solve and graph a diff equation x^2*y'=y

we tryed to agglomerate two sheets of code :

  • the one which solves (and works alone)

  • the other one which draws (and works alone)

but together they dont work (maybe because of _C ?)

any help welcome

Vinz+Erw

x = var('x'); y = function('y')
yprime=diff(y(x),x)
EqDf = (x**2)*yprime==y(x)
g(x)=desolve(EqDf, [y(x),x])
g(x)

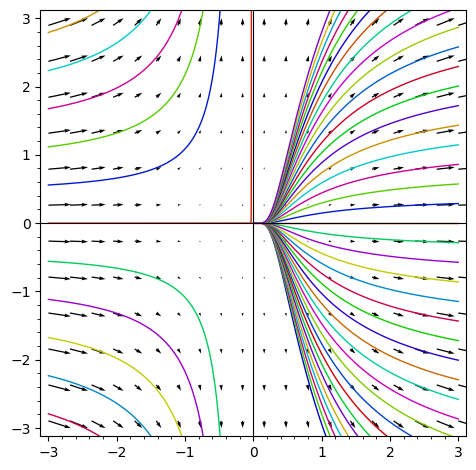
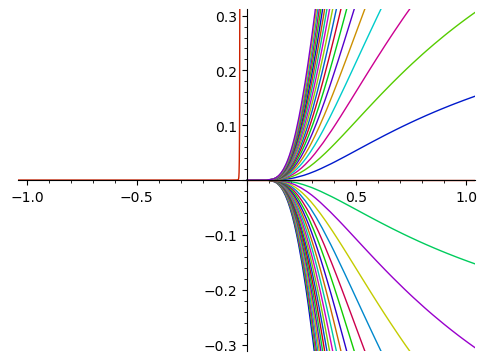
#dessin = plot([g(x) for _C in srange(-8, 8, 0.4)], (x, -3, 3))
dessin = plot(g(x), (x, -3, 3))

y = var('y')
dessin += plot_vector_field((x^2, y), (x,-3,3), (y,-5,5))`

dessin.show(aspect_ratio = 1, ymin = -3, ymax = 3)
edit retag flag offensive close merge delete

2 Answers

Sort by ยป oldest newest most voted
2

answered 2021-06-29 15:00:25 +0200

rburing gravatar image

Indeed, if you want to plot $g(x)$, the expression $g(x)$ should evaluate to a number when $x$ is a number. You correctly determined that the presence of the symbolic variable _C (introduced by the ODE solver) spoils the fun. Your attempt [g(x) for _C in srange(-8, 8, 0.4)] however creates just a list of copies of $g(x)$, without doing any substitution (that you intended). To do the subtitution, you can write e.g. [g(x).subs({var('_C') : _C}) for _C in srange(-8, 8, 0.4)]. Then it works:

ODE plot

edit flag offensive delete link more
0

answered 2021-06-29 15:10:32 +0200

slelievre gravatar image

updated 2021-06-29 15:14:14 +0200

As observed in the question, the solution contains a parameter _C.

That parameter does not get declared globally, so we need to do that before we can use it.

Here is one way using subs.

Define the variable, the function, the differential equation.

sage: x = SR.var('x')
sage: y = function('y')
sage: yprime = diff(y(x), x)
sage: de = (x^2)*yprime == y(x)
sage: de
x^2*diff(y(x), x) == y(x)

Solve.

sage: g(x) = desolve(de, [y(x), x])
sage: g
x |--> _C*e^(-1/x)

Declare the parameter as a symbolic variable.

sage: _C = SR.var('_C')

Plot solutions for a range of values of the parameter.

sage: dessin = plot([g(x).subs({_C: c}) for c in srange(-8, 8, 0.4)], (x, -3, 3))
sage: dessin.show(xmin=-1, xmax=1, ymin=-0.3, ymax=0.3)
Launched png viewer for Graphics object consisting of 80 graphics primitives

Solutions of a differential equation plotted with Sage

edit flag offensive delete link more

Your Answer

Please start posting anonymously - your entry will be published after you log in or create a new account.

Add Answer

Question Tools

Stats

Asked: 2021-06-29 13:38:26 +0200

Seen: 182 times

Last updated: Jun 29 '21