Revision history [back]
| | 1 | initial version |

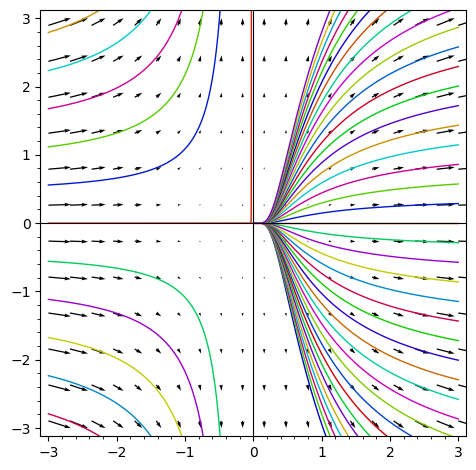
Indeed, if you want to plot $g(x)$, the expression $g(x)$ should evaluate to a number when $x$ is a number. You correctly determined that the presence of the symbolic variable _C (introduced by the ODE solver) spoils the fun. Your attempt [g(x) for _C in srange(-8, 8, 0.4)] however creates just a list of copies of $g(x)$, without doing any substitution (that you intended). To do the subtitution, you can write e.g. [g(x).subs({var('_C') : _C}) for _C in srange(-8, 8, 0.4)]. Then it works: