Ask Your Question
1

Plot points of different sizes
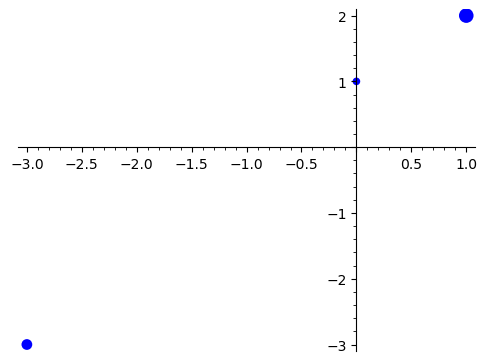
asked 2021-05-20 00:32:57 +0200

ant314159265 gravatar image

Say I have a map M:

[0,1] -> .3

[1,2] -> 1.1

[-3,-3] -> .6

etc.

I want to make a scatter plot where the point at P has size M[P]. How do I do this? Presumably I use the point2d object, which takes a size parameter.

edit retag flag offensive close merge delete

Comments

Did you define M as a function? as a dictionary? Please provide the code you wrote so far.

slelievre gravatar imageslelievre ( 2021-05-20 10:16:06 +0200 )edit

1 Answer

Sort by ยป oldest newest most voted
1

answered 2021-05-20 10:24:56 +0200

slelievre gravatar image

updated 2021-05-20 10:25:43 +0200

Using point2d is indeed the right idea.

We will need to

  • scale the values of M to turn them into reasonable point sizes for point2d.
  • use a separate point2d command for each point size

Here is an example using the values in the question:

Define M as a dictionary:

sage: M = {(0, 1): 0.3, (1, 2): 1.1, (-3, -3): 0.6}

Plot:

sage: sum(point2d([p], size=100*s) for p, s in M.items())

Scatter plot with different point sizes

edit flag offensive delete link more

Your Answer

Please start posting anonymously - your entry will be published after you log in or create a new account.

Add Answer

Question Tools

1 follower

Stats

Asked: 2021-05-20 00:32:57 +0200

Seen: 155 times

Last updated: May 20 '21