Revision history [back]
| | 1 | initial version |
Using point2d is indeed the right idea.
We will need to
- scale the values of
Mto turn them into reasonable point sizes forpoint2d. - use a separate
point2dcommand for each point size
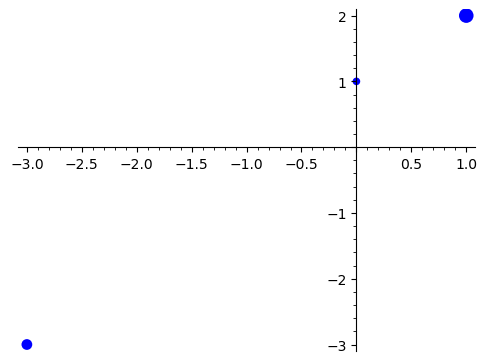
Here is an example using the values in the question:
Define M as a dictionary:
sage: M = {(0, 1): 0.3, (1, 2): 1.1, (-3, -3): 0.6}
Plot:
sage: sum(point2d([p], size=100*s) for p, s in M.items())
| | 2 | No.2 Revision |
Using point2d is indeed the right idea.
We will need to
- scale the values of
Mto turn them into reasonable point sizes forpoint2d. - use a separate
point2dcommand for each point size
Here is an example using the values in the question:
Define M as a dictionary:
sage: M = {(0, 1): 0.3, (1, 2): 1.1, (-3, -3): 0.6}
Plot:
sage: sum(point2d([p], size=100*s) for p, s in M.items())