Graphics objects have methods to get or set many of their settings.
Among these methods,
- the method
axes_color lets you get or set the axes color - the method
axes_label_color lets you get or set the axes label color - the method
tick_label_color lets you get or set the tick label color
Let us illustrate them on an example.
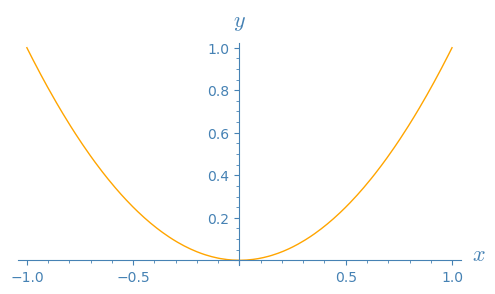
Create a graph with transparent background and axes labels:
sage: p = plot(x^2, color='orange', transparent=True, axes_labels=('$x$', '$y$'))
To know what methods exist for p, explore using TAB completion:
type p. then press the TAB key.
This reveals, among other methods, axes_color, axes_label_color, tick_label_color.
Explore the documentation with ?, for instance p.axes_color?
and find out that, if called with no argument, it gets the current
setting of axes color, and if called with an argument, it sets the
axes color to that value.
Check what the axes color, axes label color, and tick label color are set to:
sage: p.axes_color(), p.axes_label_color(), p.tick_label_color()
((0, 0, 0), (0, 0, 0), (0, 0, 0))
They are all black. Change them:
sage: p.axes_color('steelblue')
sage: p.axes_label_color('steelblue')
sage: p.tick_label_color('steelblue')
View the graph with its new color for axes, axes labels, and tick labels:
sage: p.show(aspect_ratio=1, figsize=5)
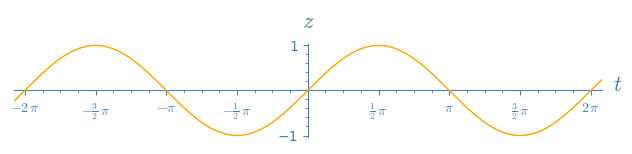
The axes are, as usual, displayed on top of the graph,
as if the graph was behind or under them.
To have the graph on top of the axes instead, set the z-order when plotting.
sage: opt = {'ticks': (pi/2, 1), 'tick_formatter': (pi, None), 'transparent': True}
sage: q = plot(sin, (-7, 7), axes_labels=('$t$', '$z$'), color='orange', zorder=3, **opt)
sage: q.axes_color('steelblue')
sage: q.axes_label_color('steelblue')
sage: q.tick_label_color('steelblue')
sage: q.show(xmin=-6.28, xmax=6.28, aspect_ratio=1)

Using
x^2andsinas toy examples, since no example was provided in the question.By "change the color of an output", do you mean change the line color of a function graph, or other graphics object, after it has been plotted?
For example, having defining
p = plot(x^2)which by default is plotted in blue, is the question about changing the plot's color from blue to another color without starting from scratch?In the answer, the axes color is changed to blue, as white would be hard to see on Ask Sage's white background.
slelievre I have forgoten to ask for the color of the axes labels.
Edited answer to recall how to explore available methods. Also added how to change axes label colors.
Easy to guess though... Since axes color is changed with
p.axes_color('beige')and tick label color is changed withp.tick_label_color('beige')one might guess that axes label color is changed withp.axes_label_color('beige').In case of doubt type the beginning of a guess then TAB, for example:
p.axthen TAB reveals methodsaxes,axes_color,axes_label_color,axes_labels,axes_labels_size,axes_range,axes_width.