Ask Your Question
2

continuous Fourier transform

asked 2020-02-19 20:38:32 +0100

Daniel L gravatar image

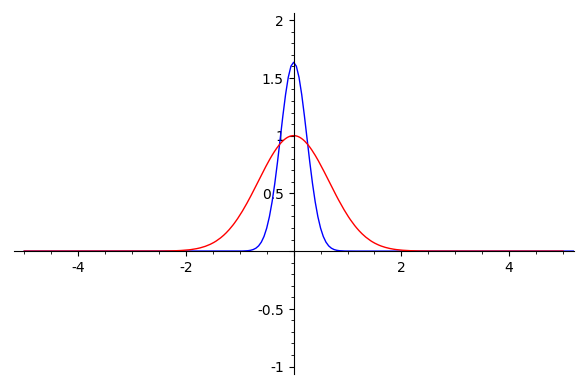
I have some basic code to plot a "nice" real-valued function and its continuous Fourier transform. For example,

F(x) = e^(-x^2)*(1-x^2)
plot2 = F.plot(xmin = -5, xmax = 5, color = 'red')
### continuous Fourier transform on RR
var('xi')
fhat(xi) = integral((F(x)*exp(-2*pi*I*x*xi)),(x,-oo,oo))
plot1 = fhat(xi).real().plot(xmin = -5, xmax = 5)   #put fhat and f in the same plot
show(plot1 + plot2, xmin = -5, xmax = 5, ymin = -1, ymax = 2)

f and fourier transform

Like many things in Sage, I appreciate it when the code looks like the formal math. However, this code is not robust. For instance, if we change the function to

F(x) = e^(-x^2)*sin(x)/x

Then I get an error message "Variable 'xi' not found". I'd like to improve this code to work with a wider class of functions.

Thanks,

edit retag flag offensive close merge delete

2 Answers

Sort by ยป oldest newest most voted
1

answered 2020-02-19 22:27:17 +0100

Emmanuel Charpentier gravatar image

updated 2020-02-20 12:54:07 +0100

Well...FWIW:

sage: var("t, omega")
(t, omega)
sage: from sympy.integrals.transforms import fourier_transform as sft
sage: from sympy.integrals.transforms import inverse_fourier_transform as isft
sage: sft?

Signature:      sft(f, x, k, **hints)
Docstring:     
   Compute the unitary, ordinary-frequency Fourier transform of f,
   defined as

      F(k) = int_{-infty}^infty f(x) e^{-2pi i x k} d x.    Signature:      sft(f, x, k, **hints)
Docstring:     
   Compute the unitary, ordinary-frequency Fourier transform of f,
   defined as

      F(k) = int_{-infty}^infty f(x) e^{-2pi i x k} d x.

   If the transform cannot be computed in closed form, this function
   returns an unevaluated "FourierTransform" object.

   For other Fourier transform conventions, see the function
   "sympy.integrals.transforms._fourier_transform()".

   For a description of possible hints, refer to the docstring of
   "sympy.integrals.transforms.IntegralTransform.doit()". Note that
   for this transform, by default "noconds=True".    

   If the transform cannot be computed in closed form, this function
   returns an unevaluated "FourierTransform" object.

   For other Fourier transform conventions, see the function
   "sympy.integrals.transforms._fourier_transform()".

   For a description of possible hints, refer to the docstring of
   "sympy.integrals.transforms.IntegralTransform.doit()". Note that
   for this transform, by default "noconds=True".

[ Abriged...]

sage: sft(e^(-t^2)*(1-t^2), t, omega)._sage_()
1/2*sqrt(pi)*(2*pi^2*omega^2 + 1)*e^(-pi^2*omega^2)
sage: isft(sft(e^(-t^2)*(1-t^2), t, omega)._sage_(), omega, t)._sage_()
-(t^2 - 1)*e^(-t^2)

EDITED : The case you propose seems hard to integrate: sympy doesn't return a result for your second case. BTW, neither maxima, sympy, fricas nor giac are able to compute the integral directly. Neither does mathematica, which seems to be able to compute the Fourier integral by less direct means :

sage: mathematica.Integrate(g(t)*e^(-2*I*pi*t*o),[t,-oo,oo])
Integrate[(E^((-2*I)*o*Pi*t - t^2)*Sin[t])/t, {t, -Infinity, Infinity}]
sage: mathematica.FourierTransform(e^(-t^2)*sin(t)/t, t, omega).sage()
1/2*sqrt(1/2)*sqrt(pi)*erf(1/2*omega + 1/2) + 1/2*sqrt(1/2)*sqrt(pi)*erf(-1/2*omega + 1/2)

WARNING All the engines do not follow the same conventins for Fourier transform parameters. See Wikipedia for alternatives...

HTH,

edit flag offensive delete link more

Comments

Thank you!

Daniel L gravatar imageDaniel L ( 2020-02-26 18:30:01 +0100 )edit
1

answered 2020-02-19 22:44:00 +0100

rburing gravatar image

At least you can always take a naive numerical approach:

F = lambda x: exp(-x^2)*sin(x)/x
plot2 = plot(F, xmin = -5, xmax = 5, color = 'red')
### continuous Fourier transform on RR
fhat_real = lambda xi: numerical_integral(lambda x: (F(x)*exp(-2*pi*I*x*xi)).real_part(),-oo,oo, eps_abs=1e-3, eps_rel=1e-3)[0]
import numpy
plot1 = list_plot([(x,fhat_real(x)) for x in numpy.arange(-5,5, step=0.05)], plotjoined=True)
show(plot1 + plot2, xmin = -5, xmax = 5, ymin = -1, ymax = 2)

Output:

fourier transform

edit flag offensive delete link more

Comments

Thank you!

Daniel L gravatar imageDaniel L ( 2020-02-26 18:29:50 +0100 )edit

Your Answer

Please start posting anonymously - your entry will be published after you log in or create a new account.

Add Answer

Question Tools

1 follower

Stats

Asked: 2020-02-19 20:38:32 +0100

Seen: 2,210 times

Last updated: Feb 20 '20