I have some basic code to plot a "nice" real-valued function and its continuous Fourier transform. For example,
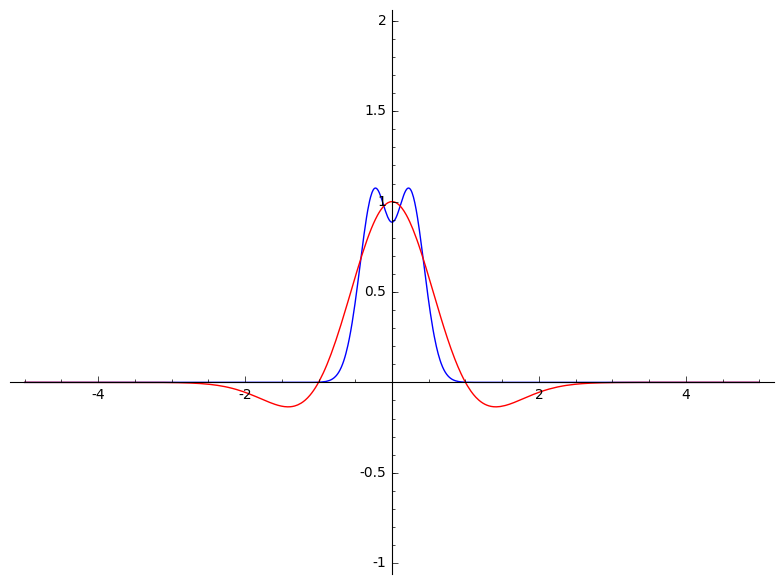
F(x) = e^(-x^2)*(1-x^2)
plot2 = F.plot(xmin = -5, xmax = 5, color = 'red')
### continuous Fourier transform on RR
var('xi')
fhat(xi) = integral((F(x)*exp(-2*pi*I*x*xi)),(x,-oo,oo))
plot1 = fhat(xi).real().plot(xmin = -5, xmax = 5)   #put fhat and f in the same plot
show(plot1 + plot2, xmin = -5, xmax = 5, ymin = -1, ymax = 2)
Like many things in Sage, I appreciate it when the code looks like the formal math. However, this code is not robust. For instance, if we change the function to
F(x) = e^(-x^2)*sin(x)/x
Then I get an error message "Variable 'xi' not found". I'd like to improve this code to work with a wider class of functions.
Thanks,
