Ask Your Question
1

Displaying Chessboard Graphs

asked 2020-02-19 04:38:26 +0100

dazedANDconfused gravatar image

I'm looking at various graphs and their plotting methods. For the code

G = graphs.KnightGraph([3,3])
G.show()

Sage displays:
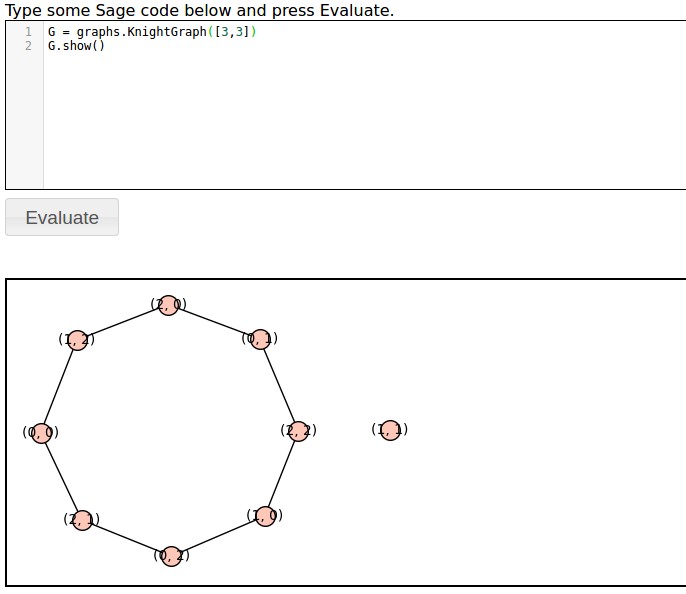
image description

I'd like the vertices to be arranged in a 3 by 3 grid so that the chessboard nature of the graph is more apparent. From the documentation here I tried specifying the position by using a dictionary:

G = graphs.KnightGraph([3,3])
pos_dict = {}
for i in range(0,2):
    for j in range(0,2):
        pos_dict[G.vertices()[3*i+j]] = [i*.5,j*.5]
pl = G.graphplot(pos=pos_dict)
pl.show()

This doesn't give the intended result. Even stranger, running the code multiple times shows the position of only some of the vertices is fixed while others change position.

How can I display an n by n chessboard graph so that it's vertices form an n by n square?

edit retag flag offensive close merge delete

1 Answer

Sort by ยป oldest newest most voted
2

answered 2020-02-19 13:49:45 +0100

rburing gravatar image

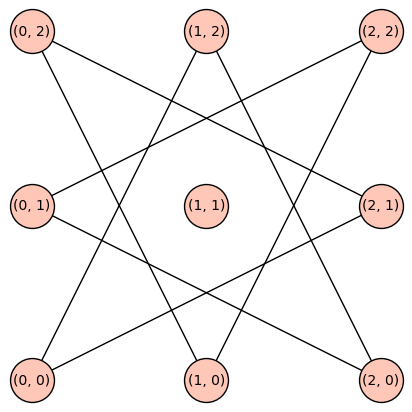
The range $[0,1,2]$ is obtained by range(0,3) or range(3).

Your pos_dict was too small because you wrote range(0,2) instead, which explains why only a subset of the vertices were fixed.

You can also use set_pos on the graph like this:

sage: G.set_pos(pos_dict)
sage: G.show(vertex_size=1000)

Knight 3x3

edit flag offensive delete link more

Your Answer

Please start posting anonymously - your entry will be published after you log in or create a new account.

Add Answer

Question Tools

1 follower

Stats

Asked: 2020-02-19 04:38:26 +0100

Seen: 644 times

Last updated: Feb 19 '20