I'm looking at various graphs and their plotting methods. For the code
G = graphs.KnightGraph([3,3])
G.show()
Sage displays:
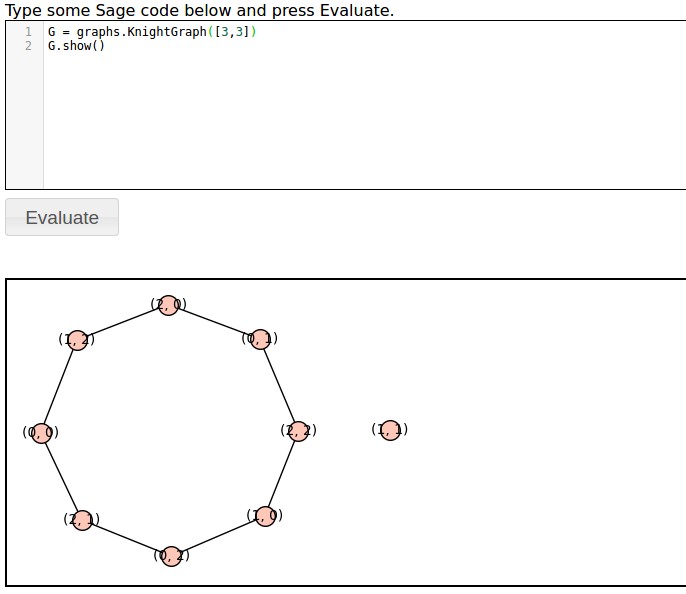
I'd like the vertices to be arranged in a 3 by 3 grid so that the chessboard nature of the graph is more apparent. From the documentation here I tried specifying the position by using a dictionary:
G = graphs.KnightGraph([3,3])
pos_dict = {}
for i in range(0,2):
    for j in range(0,2):
        pos_dict[G.vertices()[3*i+j]] = [i*.5,j*.5]
pl = G.graphplot(pos=pos_dict)
pl.show()
This doesn't give the intended result. Even stranger, running the code multiple times shows the position of only some of the vertices is fixed while others change position.
How can I display an n by n chessboard graph so that it's vertices form an n by n square?
