Ask Your Question
1

plotting multiple functions from a for loop

asked 2019-04-25 11:06:52 +0100

thetha gravatar image

updated 2019-04-25 12:07:23 +0100

This solution: https://ask.sagemath.org/question/902... is not working any more

The error is:

Error in lines 3-3
Traceback (most recent call last):
  File "/cocalc/lib/python2.7/site-packages/smc_sagews/sage_server.py", line 1188, in execute
    flags=compile_flags) in namespace, locals
  File "", line 1, in <module>
  File "/ext/sage/sage-8.7_1804/local/lib/python2.7/site-packages/sage/misc/decorators.py", line 492, in wrapper
    return func(*args, **options)
  File "/ext/sage/sage-8.7_1804/local/lib/python2.7/site-packages/sage/plot/plot.py", line 1956, in plot
    G = _plot(funcs, (xmin, xmax), **kwds)
  File "/ext/sage/sage-8.7_1804/local/lib/python2.7/site-packages/sage/plot/plot.py", line 2224, in _plot
    legend_label=legend_label_entry, legend_color=legend_color_entry, **options_temp)
  File "/ext/sage/sage-8.7_1804/local/lib/python2.7/site-packages/sage/misc/decorators.py", line 492, in wrapper
    return func(*args, **options)
  File "/ext/sage/sage-8.7_1804/local/lib/python2.7/site-packages/sage/plot/plot.py", line 1941, in plot
    G = funcs.plot(*args, **original_opts)
TypeError: plot() takes exactly 1 argument (17 given)
edit retag flag offensive close merge delete

3 Answers

Sort by ยป oldest newest most voted
1

answered 2019-04-25 19:33:43 +0100

dsejas gravatar image

Hello, @thetha. The problem is that

plotlist = [f.plot((x, 1, 10)) for f in funclist]

defines a list of Sage plots. You can verify this by writing

type(plotlist)
type(plotlist[0])

You should get:

<type 'list'>
<class 'sage.plot.graphics.Graphics'>

What you need is just one Sage plot, i.e., a <class 'sage.plot.graphics.Graphics'>, like any of the plotlist[i].

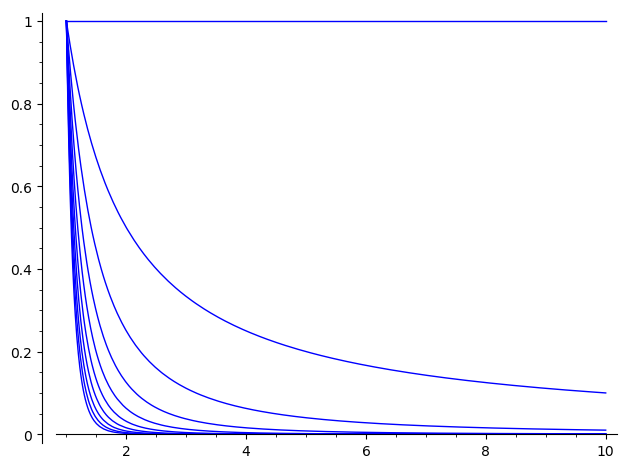
The solution is the following:

funclist = [1/x^i for i in range(10)]
plotlist = sum(f.plot((x, 1, 10)) for f in funclist)
plot(plotlist)

This way, instead of creating a list of plot, you sum all the plots together, which is equivalent to superimpose them in a single image. You can verify this by typing again:

type(plotlist)

(This time you will get <class 'sage.plot.graphics.Graphics'>, as desired.)

The result should look like this: image description

edit flag offensive delete link more
0

answered 2020-10-18 05:58:46 +0100

Shaolinux gravatar image

There seems to be a partial overlap with question #29857, see

https://ask.sagemath.org/question/298...

The answers given there might be of some interest to you.

edit flag offensive delete link more
0

answered 2020-10-17 21:38:44 +0100

cybervigilante gravatar image

updated 2020-10-18 17:05:11 +0100

Here is a py func for plotting entirely different functions in different colors on the same graph, for comparison. example: multiplot(x^4,4*x^3,13+x^-2,sin(4*x)) comes out nicely. You can change the defaults if the graph looks funny. Legend colors from top to bottom differentiate the funcs plotted, from left to right.

def multiplot(*funcs,leftx=-10,rightx=10,ymin=-20,ymax=20,aspect_ratio="automatic"):
    """Plot multiple math objects. Reasonable defaults - reset if the graph looks funny.
    Legend colors from top to bottom differentiate the funcs plotted, from left to right."""
    a = plot(funcs,leftx,rightx,aspect_ratio=aspect_ratio,ymax=ymax,ymin=ymin,
             legend_label=" ")
    return a
edit flag offensive delete link more

Comments

You can also save this func in a pickle if you use pip install cloudpickle in the sagemath shell (not your standalone python), which pickles functions and even dependencies.

cybervigilante gravatar imagecybervigilante ( 2020-10-17 21:46:46 +0100 )edit

@cybervigilante - Hint on formatting inline code, especially if it contains *: use backticks!

For example, if you use backticks around an inline code snippet as in:

To plot with colors, `multiplot(x^4, 4*x^3, 13 + x^-2, sin(4*x))` comes out nicely.

then the code is properly rendered, and can be copy pasted:

To plot with colors, multiplot(x^4, 4*x^3, 13 + x^-2, sin(4*x)) comes out nicely.

By contrast, if you omit the backticks, and type:

To plot with colors, multiplot(x^4, 4*x^3, 13 + x^-2, sin(4*x)) comes out nicely.

then rendering is botched, with * interpreted as markdown delimiters for italics:

To plot with colors, multiplot(x^4, 4x^3, 13 + x^-2, sin(4x)) comes out nicely.

slelievre gravatar imageslelievre ( 2020-10-18 08:55:12 +0100 )edit

Your Answer

Please start posting anonymously - your entry will be published after you log in or create a new account.

Add Answer

Question Tools

1 follower

Stats

Asked: 2019-04-25 11:06:52 +0100

Seen: 1,380 times

Last updated: Oct 18 '20