Revision history [back]
| | 1 | initial version |
Hello, @thetha. The problem is that
plotlist = [f.plot((x, 1, 10)) for f in funclist]
defines a list of Sage plots. You can verify this by writing
type(plotlist)
type(plotlist[0])
You should get:
<type 'list'>
<class 'sage.plot.graphics.Graphics'>
What you need is just one Sage plot, i.e., a <class 'sage.plot.graphics.Graphics'>, like any of the plotlist[i].
The solution is the following:
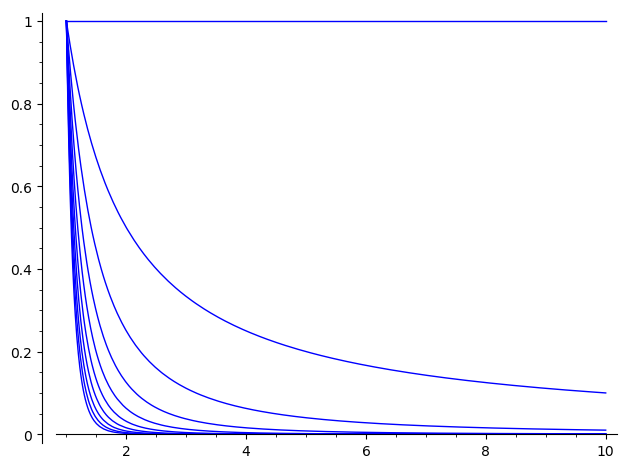
funclist = [1/x^i for i in range(10)]
plotlist = sum(f.plot((x, 1, 10)) for f in funclist)
plot(plotlist)
This way, instead of creating a list of plot, you sum all the plots together, which is equivalent to superimpose them in a single image. You can verify this by typing again:
type(plotlist)
(This time you will get <class 'sage.plot.graphics.Graphics'>, as desired.)
The result should look like this: