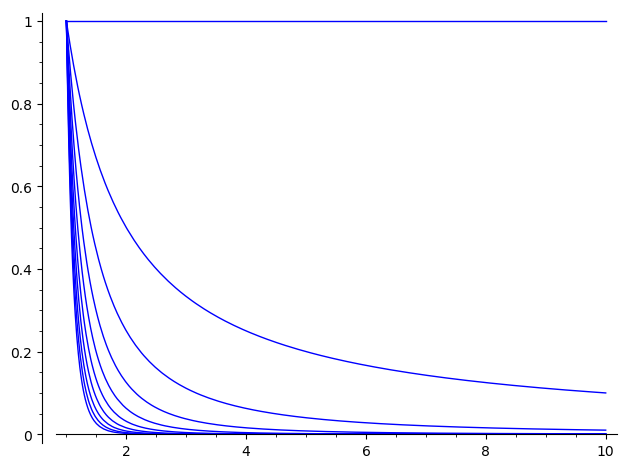
plotting multiple functions from a for loop
This solution: https://ask.sagemath.org/question/902... is not working any more
The error is:
Error in lines 3-3
Traceback (most recent call last):
  File "/cocalc/lib/python2.7/site-packages/smc_sagews/sage_server.py", line 1188, in execute
    flags=compile_flags) in namespace, locals
  File "", line 1, in <module>
  File "/ext/sage/sage-8.7_1804/local/lib/python2.7/site-packages/sage/misc/decorators.py", line 492, in wrapper
    return func(*args, **options)
  File "/ext/sage/sage-8.7_1804/local/lib/python2.7/site-packages/sage/plot/plot.py", line 1956, in plot
    G = _plot(funcs, (xmin, xmax), **kwds)
  File "/ext/sage/sage-8.7_1804/local/lib/python2.7/site-packages/sage/plot/plot.py", line 2224, in _plot
    legend_label=legend_label_entry, legend_color=legend_color_entry, **options_temp)
  File "/ext/sage/sage-8.7_1804/local/lib/python2.7/site-packages/sage/misc/decorators.py", line 492, in wrapper
    return func(*args, **options)
  File "/ext/sage/sage-8.7_1804/local/lib/python2.7/site-packages/sage/plot/plot.py", line 1941, in plot
    G = funcs.plot(*args, **original_opts)
TypeError: plot() takes exactly 1 argument (17 given)

