Ask Your Question
1

Fill colors with two contour plots

asked 2018-03-09 22:30:28 +0200

user111 gravatar image

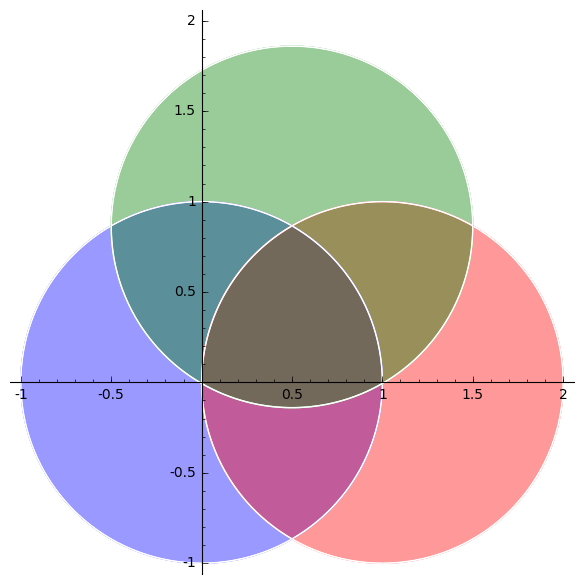
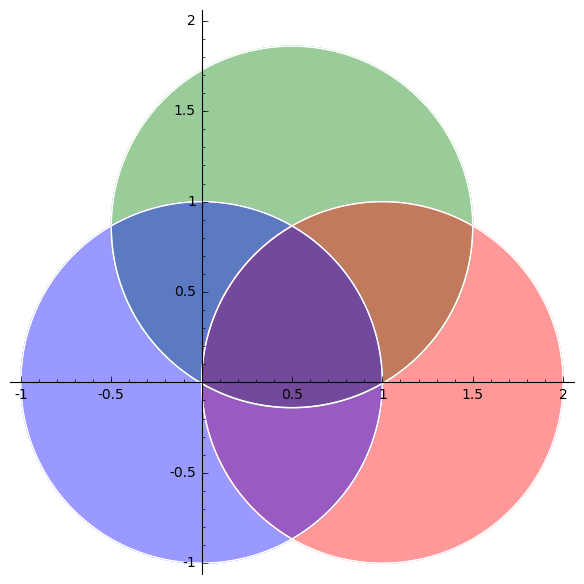
Assume I have two contour plots, of functions A and B, say, depending on x and y, with one level curve on each plot. There are two different zones in each plot, filled with two colors, like in the following:

Gr=Graphics(); 
Gr += contour_plot(A,(x,0,10),(y,0,10),contours=1,cmap=['white', 'red']);
Gr += contour_plot(B,(x,0,10),(y,0,10),contours=1,cmap=['yellow', 'blue']);
show(Gr);

The problem is that the resulting picture only shows the filling colors of the second plot.

How do I get a picture with each zone (from both plots) in a different color ? some kind of transparency ?

Sorry if my question is trivial,

Thanks !

edit retag flag offensive close merge delete

Comments

Could you please provide the code for A and B.

tmonteil gravatar imagetmonteil ( 2018-03-10 12:03:55 +0200 )edit

for instance: A = x; B = y;

user111 gravatar imageuser111 ( 2018-03-10 12:15:37 +0200 )edit

1 Answer

Sort by » oldest newest most voted
3

answered 2018-03-15 23:19:16 +0200

Sébastien gravatar image

updated 2018-03-15 23:23:12 +0200

In Sage, there is a argument called alpha which allows to define transparency. For example, it is documented in line2d? and in text? which says "alpha - A float (0.0 transparent through 1.0 opaque)". Unfortunately, contour_plot does no allow to use alpha as input.

You may use region_plot instead which allows to use the argument alpha even if not documented:

sage: x,y = var('x,y')
sage: A = region_plot(x^2 + y^2 < 1, (x,-1,2), (y,-1,2), incol='blue', alpha=.4)
sage: B = region_plot((x-1)^2 + y^2 < 1, (x,-1,2), (y,-1,2), incol='red', alpha=.4)
sage: C = region_plot((x-.5)^2 + (y-.86)^2 < 1, (x,-1,2), (y,-1,2), incol='green', alpha=.4)
sage: A+B+C

image description

Note that the color output is not commutative (!):

sage: C+B+A

image description

edit flag offensive delete link more

Comments

Wonderful ! Thank you (sorry that I can't upvote).

user111 gravatar imageuser111 ( 2018-03-16 13:34:22 +0200 )edit

Your Answer

Please start posting anonymously - your entry will be published after you log in or create a new account.

Add Answer

Question Tools

1 follower

Stats

Asked: 2018-03-09 22:30:28 +0200

Seen: 887 times

Last updated: Mar 15 '18