Revision history [back]
| | 1 | initial version |
In Sage, there is a argument called alpha which allows to define transparency. For example, it is documented in line2d? and in text? which says "alpha - A float (0.0 transparent through 1.0 opaque)". Unfortunately, contour_plot does no allow to use alpha as input.
You may use region_plot instead which allows to use the argument alpha for transparency (0=transparent, 1=opaque):
sage: x,y = var('x,y')
sage: A = region_plot(x^2 + y^2 < 1, (x,-1,2), (y,-1,2), incol='blue', alpha=.4)
sage: B = region_plot((x-1)^2 + y^2 < 1, (x,-1,2), (y,-1,2), incol='red', alpha=.4)
sage: C = region_plot((x-.5)^2 + (y-.86)^2 < 1, (x,-1,2), (y,-1,2), incol='green', alpha=.4)
sage: A+B+C
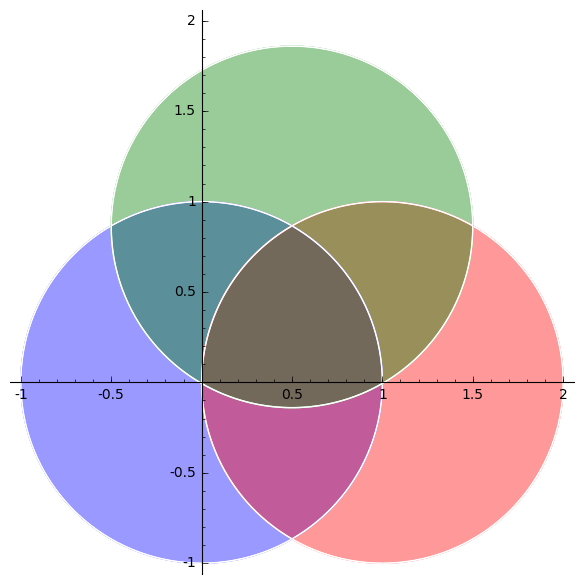
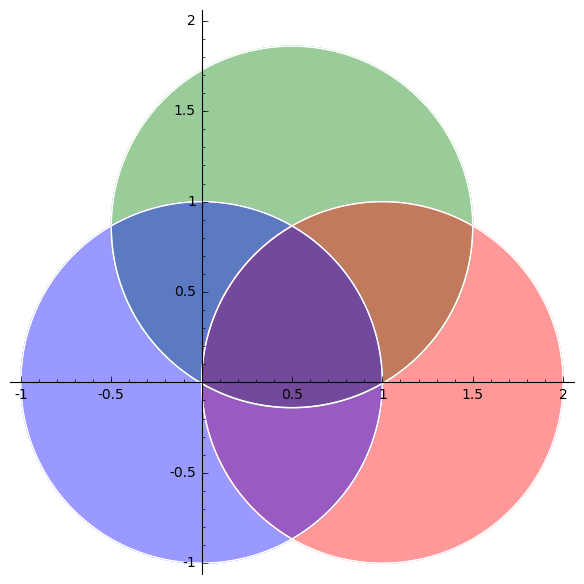
Note that the color output is not commutative (!):
sage: C+B+A
| | 2 | No.2 Revision |
In Sage, there is a argument called alpha which allows to define transparency. For example, it is documented in line2d? and in text? which says "alpha - A float (0.0 transparent through 1.0 opaque)". Unfortunately, contour_plot does no allow to use alpha as input.
You may use region_plot instead which allows to use the argument alpha for transparency (0=transparent, 1=opaque):even if not documented:
sage: x,y = var('x,y')
sage: A = region_plot(x^2 + y^2 < 1, (x,-1,2), (y,-1,2), incol='blue', alpha=.4)
sage: B = region_plot((x-1)^2 + y^2 < 1, (x,-1,2), (y,-1,2), incol='red', alpha=.4)
sage: C = region_plot((x-.5)^2 + (y-.86)^2 < 1, (x,-1,2), (y,-1,2), incol='green', alpha=.4)
sage: A+B+C
Note that the color output is not commutative (!):
sage: C+B+A
