How to plot a complicated function in Sage Math
I apologize in advance for my lack of knowledge and understanding of sage. In principle what I want to achieve is the visualization of this function:
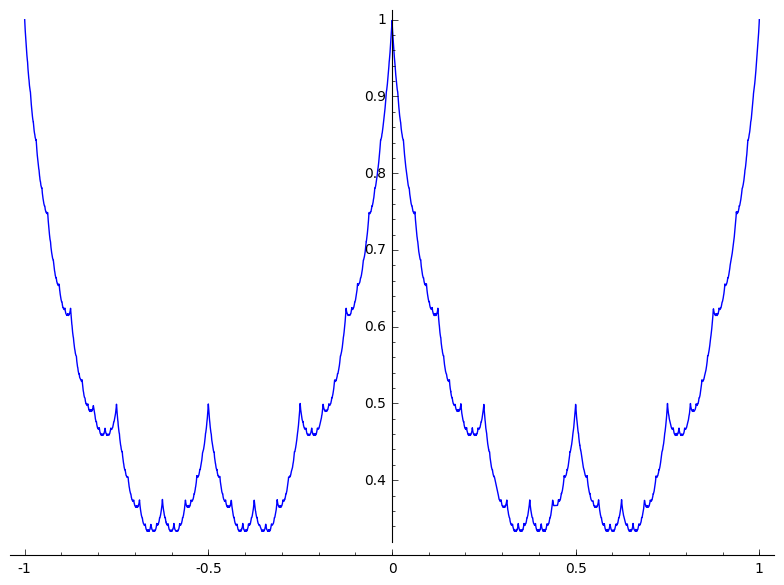
$$ g \mapsto \left|x - \lfloor{x}\rfloor - \frac{1}{2} \right| $$ $$f(x) := \sum_{j=0}^\infty 2^{-j}g(2^jx)$$
Though I am having trouble finding out how to do this. In the documentation I did not find any easy way to handle infinite series.
I am sure this would be very helpful to many that struggle with a math problem and need to see it to believe it. A conventional plotting program will not work here, hence I searched for a better tool and found Sage Math. Is it possible in sage? Do you have any TLDR material that I could look into?
Thank you for your help.

So do you want to plot a function which is 1 for x>=0 and +Infinity for x<0?
My bad I thought it was abs(x) instead of floor(x)