Revision history [back]
| | 1 | initial version |
Here's an example to illustrate some of the documentation:
f=x/(x^2-1)+1
p1 = plot(f,(-5,5), detect_poles='show',color='green', ymin=-10,ymax=10)
p2 = plot(1,(-5,5), color='red', linestyle='--')
show(p1+p2)
Run the code in a Sage Cell Server and you'll get:
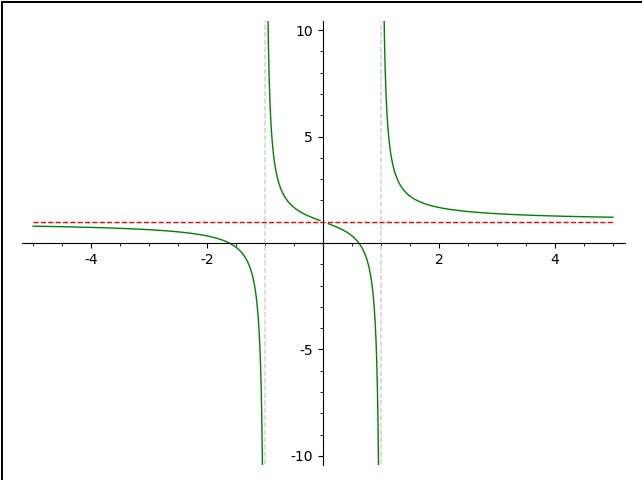
The vertical asymptotes are done automatically with detect_poles='show' in plotting f. The result is put into p1. Since vertical asymptotes involve the function going off to plus or minus infinity, ymin=-10,ymax=10 sets the values to which the plot will go. The horizontal asymptotes are something you need to find; of course, SAGE can help. There is one horizontal asymptote and I've put its plot in p2. Finally, I combine the 2 using show()
