Revision history [back]
| | 1 | initial version |

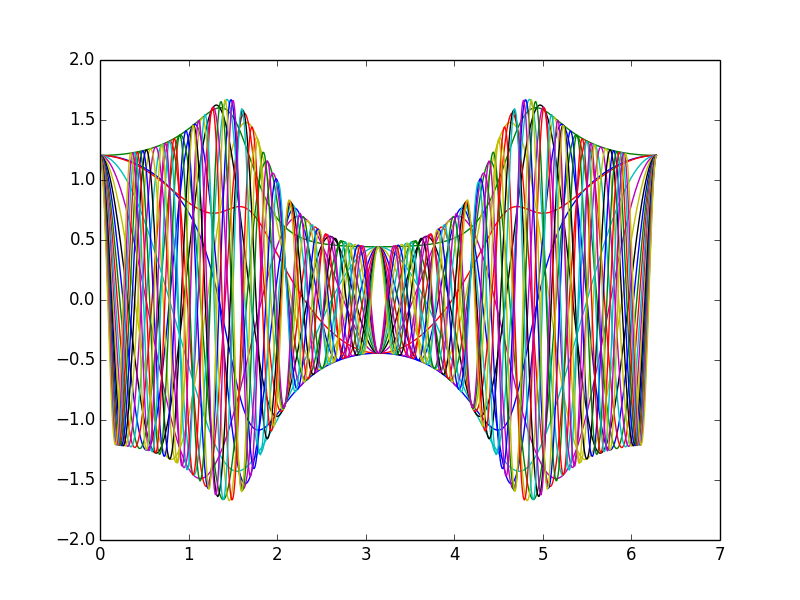
A possibility would be to use matplotlib+numpy. For example:
import numpy as np
import matplotlib.pyplot as plt

def get_f( n ):
    i=np.complex(0,1)
    def func(t):
        return np.exp(i*t*(1-n))*(1+(np.exp(np.exp(i*t))-1)/(np.exp(2*np.exp(i*t))+1))
    return func

def mat_plot():
    t = np.arange(0.,2*np.pi,0.01)
    for i in range(20):
        func = get_f(i)
        ft = func(t)
        plt.plot(t,np.real(ft))
    plt.show()
    plt.clf()
Takes only 0.5s at SMC (and 234ms on my laptop). Sample output: