Lars's profile - activity
| 2022-08-22 10:43:11 +0200 | received badge | ● Notable Question (source) |
| 2022-07-22 05:41:30 +0200 | received badge | ● Notable Question (source) |
| 2022-07-22 05:41:30 +0200 | received badge | ● Popular Question (source) |
| 2021-10-17 14:32:56 +0200 | received badge | ● Popular Question (source) |
| 2021-02-05 22:27:45 +0200 | received badge | ● Editor (source) |
| 2021-02-05 22:27:03 +0200 | asked a question | Export a Plot as Tikz to Latex Hello, a couple of days ago I drew a Polyhedra in sage cell Server and exported it as a Tikz file. like this: P1 = Polyhedron(vertices = [[0,0,0], [1,2,1], [-4,-3,-2],[3,3,-2],[1,-4,3],[-2,2,1]]) P1.tikz([-0.0946,-0.4796,-0.8724],160.47, axis=true, opacity=0.25) Now I got an Arrangement of Hyperplanes like: H3.<x,y,z> = HyperplaneArrangements(QQ) A = H3([(1,2,1), 0], [(-4,-3,-2), 0],[(3,3,-2), 0], [(1,-4,3), 0],[(-2,2,1), 0]) that I want to export as a Tikz file but it seems that this is not possible. Or am I just doesnt find it? Anyone there that can maybe help me? Best regards Lars Kroll |
| 2021-02-05 22:21:45 +0200 | answered a question | Ranging the Z axis That is awesome thank you! |
| 2021-01-19 15:59:53 +0200 | received badge | ● Student (source) |
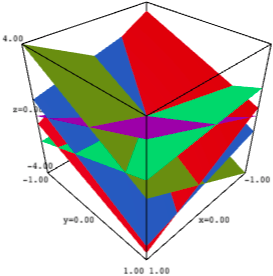
| 2021-01-19 15:53:09 +0200 | asked a question | Ranging the Z axis I am plotting arrangements of hyperplanes. Like this one:
The problem is I need the z axis to range from -1 to 1 rather than from -4 to 4. Is there a way to change that? |
| 2021-01-19 15:53:09 +0200 | asked a question | Is there a way to range the z axis? Hello, i am trying to plot an Arrangement of Hyperplanes. Like this one: H3.<x,y,z> = HyperplaneArrangements(QQ) A = H3([(1,2,1), 0], [(-4,-3,-2), 0],[(3,3,-2), 0], [(1,-4,3), 0],[(-2,2,1), 0]) A.plot(ranges=[[-1, 1], [-1, 1]],aspect_ratio=[1,1,0.25]) And i am trying to find find a way to range the z axis only from -1 to 1 not from -4 to 4 like it is when i am runnnig the code. Is there a way? i would be very grateful! Best regards Lars |