
hi i try this code :
y=var('y')#x l'est déjà par défaut
coef=10
g = plot_vector_field((x*coef, 2*y*coef), (x,-4,4), (y,-3,3),
        gridlines=True, gridlinesstyle=dict(color="blue", linestyle=":"),
        frame=False, axes=True)
show(g)
because my student discovery vector fields
first we have drawn, by hand on the paper, this vector field
they have understood that from the point (1,1) they have to draw the vector (1,2), they have counted on the grid to do this precisely
but now on the result :
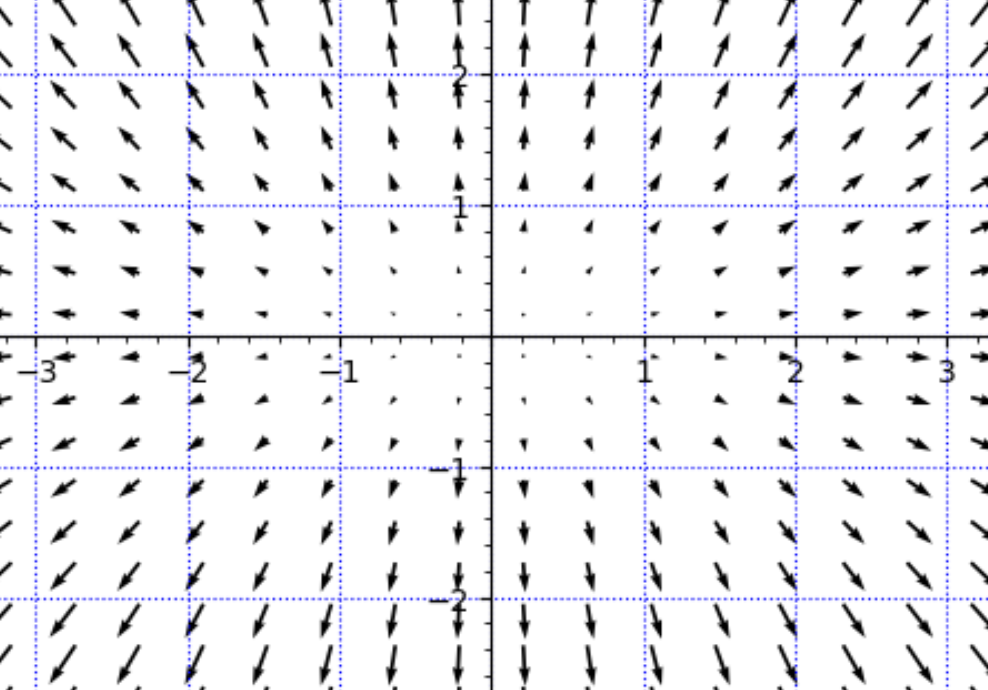 you can see that Sagemath have converted the units in some way, maybe for lisibility, so that the vecteur on (1,1) is only colinear to (1,2) but IS not (1,2).
how can i understand where to customize the factor of conversion that Sagemath uses. Or, at least, to understand how it is calculated ?
you can see that Sagemath have converted the units in some way, maybe for lisibility, so that the vecteur on (1,1) is only colinear to (1,2) but IS not (1,2).
how can i understand where to customize the factor of conversion that Sagemath uses. Or, at least, to understand how it is calculated ?
