Sorry, some of you think that I do not read the docs but the truth is that
even reading them I cannot find my way.
Before using SageMath I was mainly working with
PSTricks with which I have no problem
drawing what I expect. If only it could be incorporated completely
it would be a great moment.
Here is my problem: the code below works but I do not understand
how to set the vertex attributes, the size of nodes, and so on.
A = matrix([
[1,1,0,1,0,0,0,0,0],
[1,1,1,0,1,0,0,0,0],
[0,1,1,0,0,1,0,0,0],
[1,0,0,1,1,0,1,0,0],
[0,1,0,1,1,1,0,1,0],
[0,0,1,0,1,1,0,0,1],
[0,0,0,1,0,0,1,1,0],
[0,0,0,0,1,0,1,1,1],
[0,0,0,0,0,1,0,1,1]])
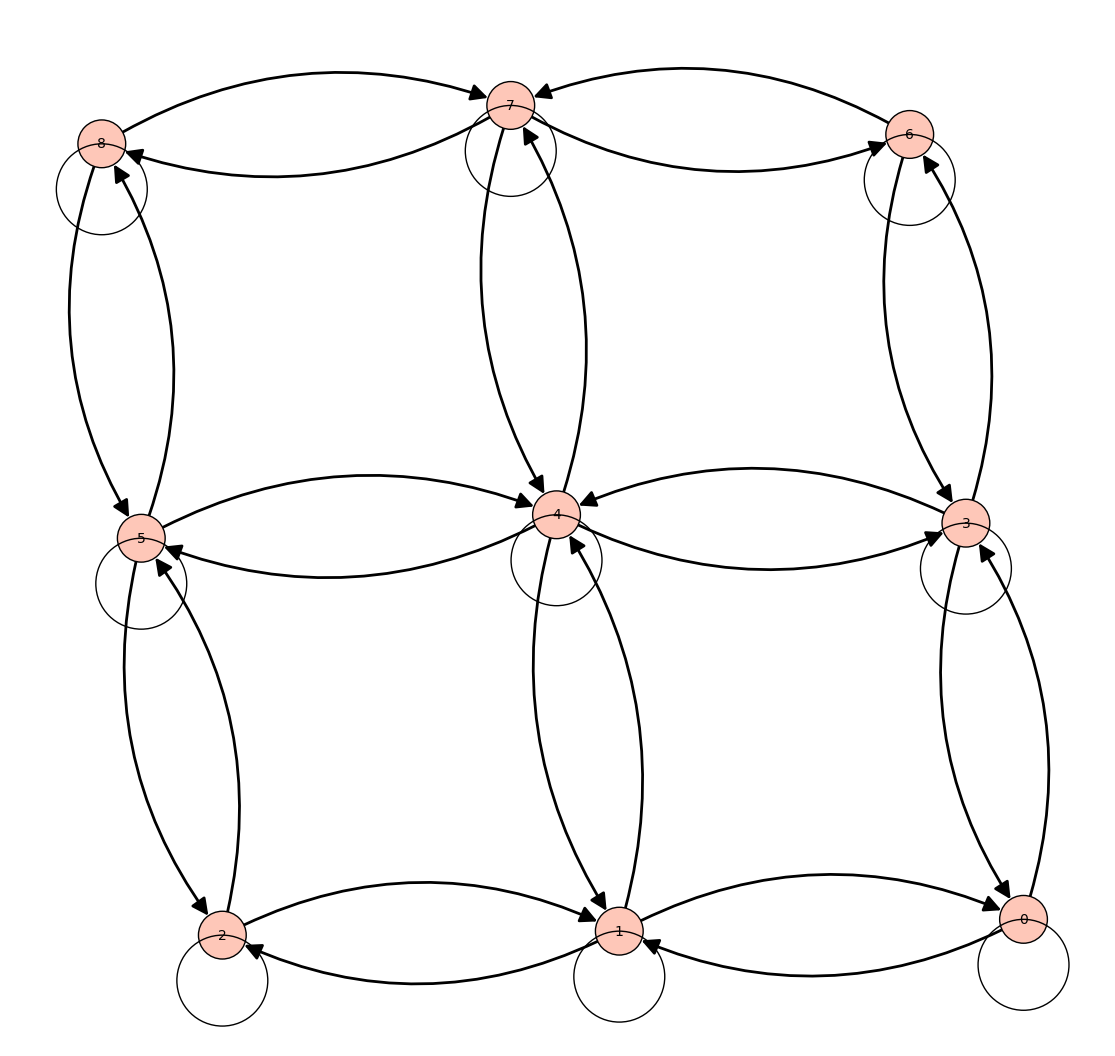
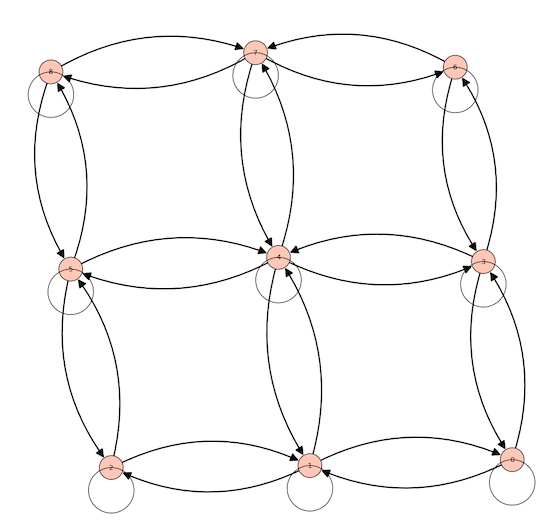
D = DiGraph(A, format='adjacency_matrix')
D.show(figsize=16, vertex_size=100)
But I do not understand how to set the vertex attributes,
the size of the nodes, and so on.
I even wonder why loops have no arrow head, why loops
are plotted on top of nodes rather than underneath them.
This is for my very strange since I have understood
how to change the colors of the arcs. I truly need help
(sorry to waste your time). I would also like to know
if one can use images as vertex attributes.
vertex_attrs={'label':['1','2','3','4','5','6','7','8','9',]}
Added to answer @slelievre's comments
First of all my above code is only 3 lines.
I have made many tries to insert vertex_attributes. None works.
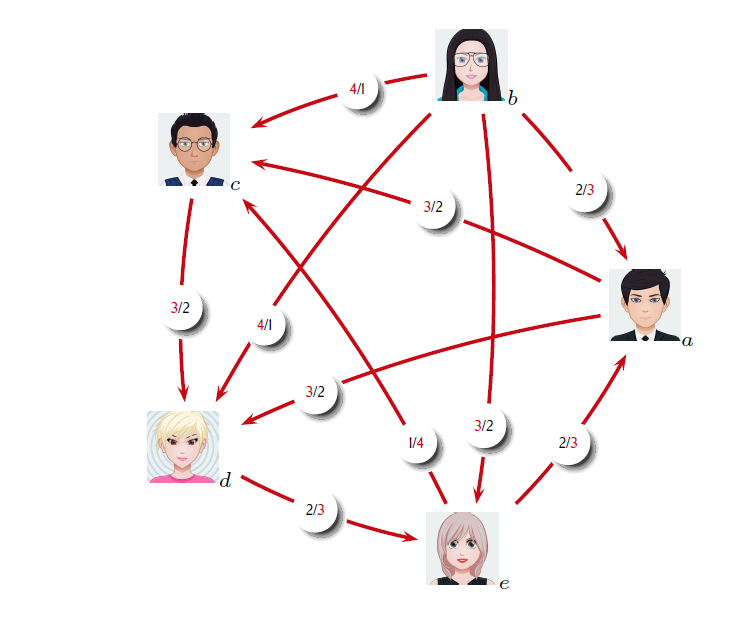
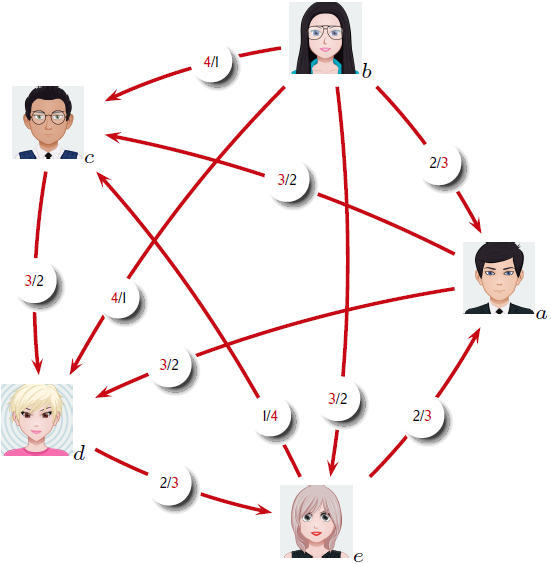
Here is what I am able to achieve with PSTricks:
I can provide the code. As I told you (this is also an answer
to the comment to @dazedANDconfused), I work now mainly
in html with SageCell because it's mandatory in these
lockdown times. Most of my students (in economics) are poorly
endowed in computers (some work with tablets or even phones).
With html embedded SageCells I can overcome all those
difficulties since computation are not realized in situ.
I was delighted in discovering Latex2js since their exemples
are incredible. But all my trials are poor. It is not complete
and their sandbox doesn't work (at least for me). But I think
also that as SageMath is a pure killing software,
it must be raised to that level.
Science is a pure public good. We are paid by government to increase
common knowledge. But it is difficult to share it if you must pay
for being published or to acquire software.
The PSTricks code and images you ask node images as requested by slelievre
Pay attentionmy Latex header is full
Note: my LaTeX preamble uses lots of PStricks package packages and I do not not
remember which are in use used for this particular graph (I use also *graphix).
\begin{figure}[H]
\begin{center}
\begin{pspicture}(-3.2,-3.6)(3.6,3.6)
%\psgrid
%\pscircle(0,0){3cm}
\SpecialCoor
\rput(3;0){\rnode{A}{\includegraphics[scale=.25]{Avat0.png}$_a$}}
\rput(3;72){\rnode{B}{\includegraphics[scale=.25]{Avat1.png}$_b$}}
\rput(3;142){\rnode{C}{\includegraphics[scale=.25]{Avat2.png}$_c$}}
\rput(3;214){\rnode{D}{\includegraphics[scale=.25]{Avat5.png}$_d$}}
\rput(3;286){\rnode{E}{\includegraphics[scale=.25]{Avat4.png}$_e$}}
\ncarc[nodesep=3pt,linecolor=venetianred,linewidth=1.2pt]{->}{B}{A}
\ncarc[nodesep=3pt,linecolor=venetianred,linewidth=1.2pt]{<-}{C}{A}
\ncarc[nodesep=3pt,linecolor=venetianred,linewidth=1.2pt]{<-}{D}{A}
\ncarc[nodesep=3pt,linecolor=venetianred,linewidth=1.2pt]{<-}{A}{E}
\ncarc[nodesep=3pt,linecolor=venetianred,linewidth=1.2pt]{<-}{C}{B}
\ncarc[nodesep=3pt,linecolor=venetianred,linewidth=1.2pt]{<-}{D}{B}
\ncarc[nodesep=3pt,linecolor=venetianred,linewidth=1.2pt]{->}{B}{E}
\ncarc[nodesep=3pt,linecolor=venetianred,linewidth=1.2pt]{<-}{D}{C}
\ncarc[nodesep=3pt,linecolor=venetianred,linewidth=1.2pt]{<-}{E}{D}
\ncarc[nodesep=3pt,linecolor=venetianred,linewidth=1.2pt]{<-}{C}{E}
\NormalCoor
\cnodeputlinestyle=none,fillstyle=solid, fillcolor=white, shadow=true,blur=true{AA}{\tiny2/\textcolor{venetianred}3}
\cnodeputlinestyle=none,fillstyle=solid, fillcolor=white, shadow=true,blur=true{BB}{\tiny\textcolor{venetianred}{3}/2}
\cnodeputlinestyle=none,fillstyle=solid, fillcolor=white, shadow=true,blur=true{CC}{\tiny\textcolor{venetianred}{3}/2}
\cnodeputlinestyle=none,fillstyle=solid, fillcolor=white, shadow=true,blur=true{DD}{\tiny2/\textcolor{venetianred}{3}}
\cnodeputlinestyle=none,fillstyle=solid, fillcolor=white, shadow=true,blur=true{EE}{\tiny\textcolor{venetianred}{4}/1}
\cnodeputlinestyle=none,fillstyle=solid, fillcolor=white, shadow=true,blur=true{FF}{\tiny\textcolor{venetianred}{4}/1}
\cnodeputlinestyle=none,fillstyle=solid, fillcolor=white, shadow=true,blur=true{GG}{\tiny\textcolor{venetianred}{3}/2}
\cnodeputlinestyle=none,fillstyle=solid, fillcolor=white, shadow=true,blur=true{HH}{\tiny\textcolor{venetianred}{3}/2}
\cnodeputlinestyle=none,fillstyle=solid, fillcolor=white, shadow=true,blur=true{II}{\tiny1/\textcolor{venetianred}{4}}
\cnodeputlinestyle=none,fillstyle=solid, fillcolor=white, shadow=true,blur=true{KK}{\tiny2/\textcolor{venetianred}{3}}
\cnodeput[linestyle=none,fillstyle=solid, fillcolor=white, shadow=true,blur=true](2.2,1.4){AA}{\tiny2/\textcolor{venetianred}3}
\cnodeput[linestyle=none,fillstyle=solid, fillcolor=white, shadow=true,blur=true](0.4,1.2){BB}{\tiny\textcolor{venetianred}{3}/2}
\cnodeput[linestyle=none,fillstyle=solid, fillcolor=white, shadow=true,blur=true](-1,-1){CC}{\tiny\textcolor{venetianred}{3}/2}
\cnodeput[linestyle=none,fillstyle=solid, fillcolor=white, shadow=true,blur=true](2,-1.6){DD}{\tiny2/\textcolor{venetianred}{3}}
\cnodeput[linestyle=none,fillstyle=solid, fillcolor=white, shadow=true,blur=true](-.5,2.6){EE}{\tiny\textcolor{venetianred}{4}/1}
\cnodeput[linestyle=none,fillstyle=solid, fillcolor=white, shadow=true,blur=true](-1.6,-.2){FF}{\tiny\textcolor{venetianred}{4}/1}
\cnodeput[linestyle=none,fillstyle=solid, fillcolor=white, shadow=true,blur=true](1.,-1.4){GG}{\tiny\textcolor{venetianred}{3}/2}
\cnodeput[linestyle=none,fillstyle=solid, fillcolor=white, shadow=true,blur=true](-2.6,0){HH}{\tiny\textcolor{venetianred}{3}/2}
\cnodeput[linestyle=none,fillstyle=solid, fillcolor=white, shadow=true,blur=true](.2,-1.6){II}{\tiny1/\textcolor{venetianred}{4}}
\cnodeput[linestyle=none,fillstyle=solid, fillcolor=white, shadow=true,blur=true](-1,-2.4){KK}{\tiny2/\textcolor{venetianred}{3}}
\end{pspicture}
\end{center}
\caption{\textsc{Scores dans les confrontations deux à deux}}\label{condorcetcomp}
\end{figure} 


\end{figure}
Node images: a
· b
· c
· d
· e.
Good work luck working on that but I think it will be simpler to extend theshow show command to pstricks. In that case Sagemath woul become use PSTricks. That would make SageMath a pure wonder!