If I plot two log equations in x and y I get an obvious intersection, but when I try solve on them I get nothing. Is there a way to get a mathematical solution that gibes with the plot?
var('x y')
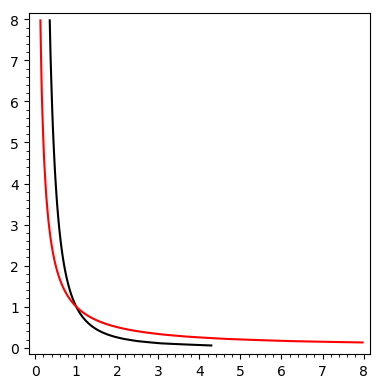
implicit_plot(log(x*sqrt(y)),(x,0,8),(y,0,8),color="black") + implicit_plot(log(x^2*y^2),(x,0,8),(y,0,8),color="red")
solve(log(x*sqrt(y)) == log(x^2*y^2),x,y)
[]