Hi. I have done some research on how to build my graph based on the info i obtained from http://doc.sagemath.org/html/en/reference/plotting/sage/plot/plot.html
Here is what I have done :
h=plot(x, (x,-73.83,73.83),linestyle="--")
g=plot(-0.7350*x+67, (x,-73.83,73.83),linestyle="--")
r=list_plot([(11.13,58.82),(4.99,10.03),(17.24,42.79),(23.80,-73.83),(57.84,-37.82)], axes_labels=['(+) GE','(+) CE']))
r += text('A CMSCI = 0.131', (11.135, 58.82))
H = h + g + r;H
print(H)
which gave me this below:
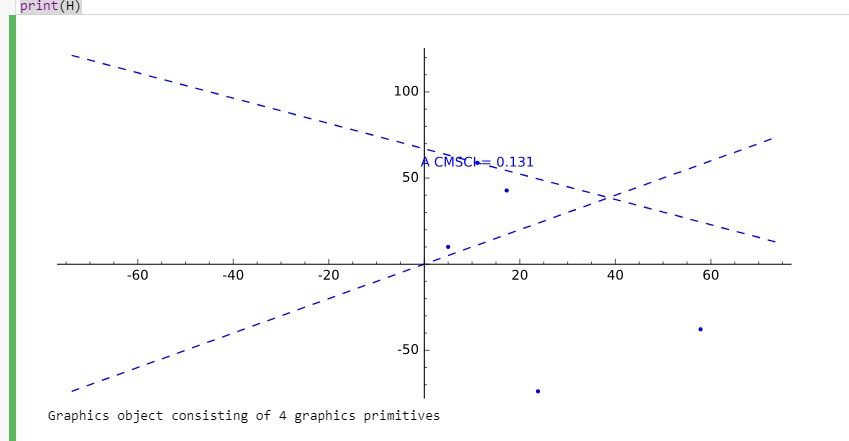
It looks almost the same as how i want it to be which is (at least the lines and the points are there (haha)):
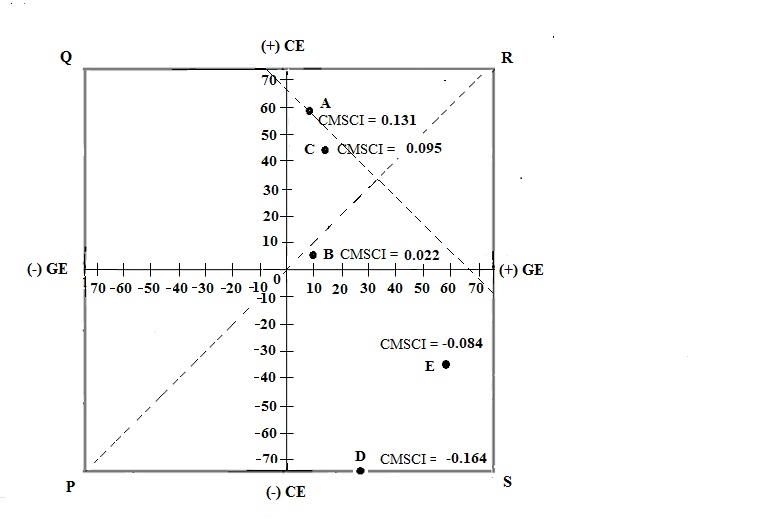
Few questions here:
- how to scale the axis properly. my y-axis is wider than x-axis
- how to form the outer box and add P, Q, R, S labels
- i manage to form the axis title only for (+)GE and (+)CE, how about the (-) ones?
Thank you.
