Ask Your Question
1

Minimum length of edges in a graph (that is a tree)

asked 2012-10-20 10:10:11 +0200

stianfauskanger gravatar image

updated 2020-12-27 15:29:57 +0200

slelievre gravatar image

I'm trying to plot a graph.

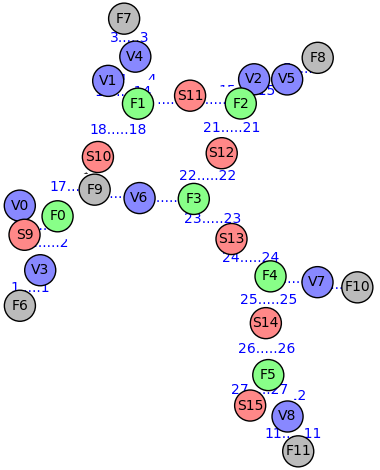
The vertices are placed too close to each-other, so that i cant read the edge labels.

Is there a way to specify a minimum edge length?

Here are an example of how the labels are hard to read.

Sage code (also posted at codepad):

msg_list =  [('F6', 'V3'), ('V3', 'F0'), ('F7', 'V4'), ('V4', 'F1'),
('F8', 'V5'), ('V5', 'F2'), ('F9', 'V6'), ('V6', 'F3'), ('F10', 'V7'),
('V7', 'F4'), ('F11', 'V8'), ('V8', 'F5'), ('V0', 'F0'), ('V1', 'F1'),
('V2', 'F2'), ('S9', 'F0'), ('F0', 'S10'), ('S10', 'F1'), ('F1', 'S11'),
('S11', 'F2'), ('F2', 'S12'), ('S12', 'F3'), ('F3', 'S13'), ('S13',
'F4'), ('F4', 'S14'), ('S14', 'F5'), ('F5', 'S15')]

c =  {'#BBBBBB': ['F6', 'F7', 'F8', 'F9', 'F10', 'F11'], '#8888FF':
['V0', 'V1', 'V2', 'V3', 'V4', 'V5', 'V6', 'V7', 'V8'], '#FF8888':
['S9', 'S10', 'S11', 'S12', 'S13', 'S14', 'S15'], '#88FF88': ['F0',
'F1', 'F2', 'F3', 'F4', 'F5']}

G_forward = DiGraph([], loops=False, multiedges=False)
msg_nr = 1
for v_from, v_to in msg_list:
    G_forward.add_edge((v_from, v_to), label=str(msg_nr) + "....." + str(msg_nr))
    msg_nr += 1

G_forward.plot(layout="spring", edge_labels=True, vertex_size=500,
vertex_colors=c).show()
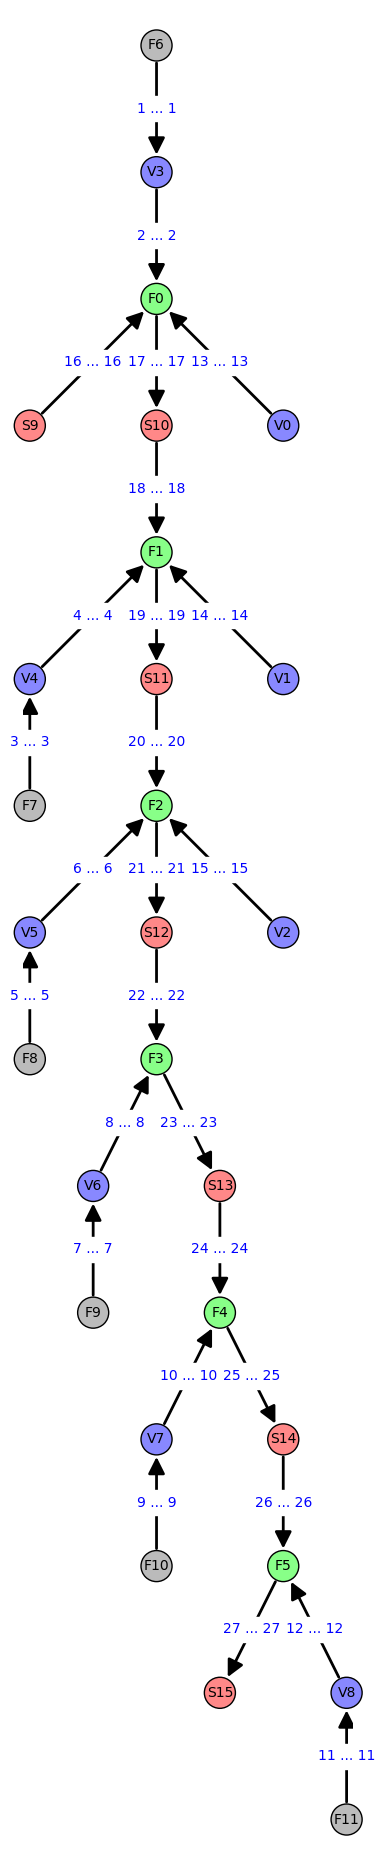
Result

Unsatisfactory graph plot: respective sizes mask edges etc.

The result as seen on SageCell

edit retag flag offensive close merge delete

Comments

Sorry that this stayed unanswered for so long!

slelievre gravatar imageslelievre ( 2020-12-27 15:20:08 +0200 )edit

1 Answer

Sort by ยป oldest newest most voted
0

answered 2020-12-27 15:15:28 +0200

slelievre gravatar image

updated 2020-12-27 15:25:35 +0200

One way is to set the figsize optional parameter in show to a large value such as 20 or more. Indeed, some lengths (such as distances between nodes) scale with the figure size whereas others (such as font size and line thickness) don't.

One can also play with the graph plotting algorithm; in this case, one could use 'tree' or 'planar' in addition to 'spring', and see if they result in better spread out vertices ('tree' is a good choice here).

Example:

msg_list =  [
    ('F6', 'V3'), ('V3', 'F0'), ('F7', 'V4'), ('V4', 'F1'),
    ('F8', 'V5'), ('V5', 'F2'), ('F9', 'V6'), ('V6', 'F3'),
    ('F10', 'V7'), ('V7', 'F4'), ('F11', 'V8'), ('V8', 'F5'),
    ('V0', 'F0'), ('V1', 'F1'), ('V2', 'F2'), ('S9', 'F0'),
    ('F0', 'S10'), ('S10', 'F1'), ('F1', 'S11'), ('S11', 'F2'),
    ('F2', 'S12'), ('S12', 'F3'), ('F3', 'S13'), ('S13', 'F4'),
    ('F4', 'S14'), ('S14', 'F5'), ('F5', 'S15')
]

c =  {
    '#BBBBBB': ['F6', 'F7', 'F8', 'F9', 'F10', 'F11'],
    '#8888FF': ['V0', 'V1', 'V2', 'V3', 'V4', 'V5', 'V6', 'V7', 'V8'],
    '#FF8888': ['S9', 'S10', 'S11', 'S12', 'S13', 'S14', 'S15'],
    '#88FF88': ['F0', 'F1', 'F2', 'F3', 'F4', 'F5']
}

G = DiGraph([], loops=False, multiedges=False)
msg_nr = 1

for v_from, v_to in msg_list:
    G.add_edge((v_from, v_to), label=f"{msg_nr} ... {msg_nr}")
    msg_nr += 1

opt = {'edge_labels': True, 'vertex_colors': c, 'vertex_size': 500}

p = G.plot(layout='planar', **opt)
p.show(figsize=25)

s = G.plot(layout='spring', **opt)
s.show(figsize=25)

t = G.plot(layout='tree', **opt)
t.show(figsize=25)

Graph with tree layout and large figsize

edit flag offensive delete link more

Your Answer

Please start posting anonymously - your entry will be published after you log in or create a new account.

Add Answer

Question Tools

Stats

Asked: 2012-10-20 10:10:11 +0200

Seen: 1,288 times

Last updated: Dec 27 '20