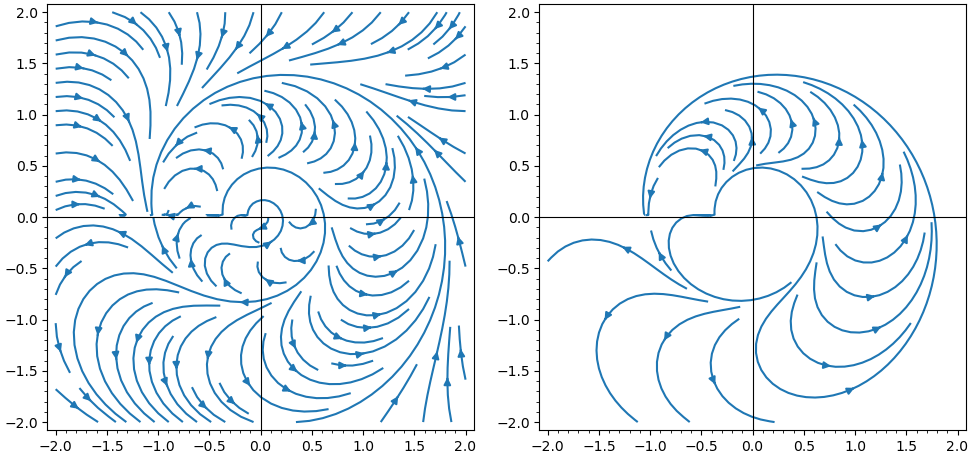
I think it is a kind of a stream plot. Unfortunately streamline_plot does not have appropriate options to make the plot look better.
Maybe choosing different start_points can help.
x, y, z, w = var('x y z w')
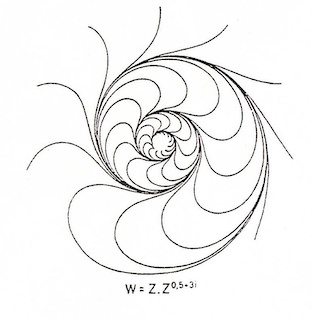
z = x + y*I
w = z*z^(1/2 + 3*I)
show(streamline_plot((w.real(), w.imag()), (x, -2, 2), (y, -2, 2), plot_points = 100, density = 1, aspect_ratio = 1))
streamline_plot((w.real(), w.imag()), (x, -2, 2), (y, -2, 2), plot_points = 100, density = 1.5, aspect_ratio = 1, start_points=[[0.130526, -0.991445], [0.382683, -0.92388], [0.608761, -0.793353], [0.793353, -0.608761], [0.92388, -0.382683], [0.991445, -0.130526], [0.991445, 0.130526], [0.92388, 0.382683], [0.793353, 0.608761], [0.608761, 0.793353], [0.382683, 0.92388], [0.130526, 0.991445], [-0.130526, 0.991445], [-0.382683, 0.92388], [-0.608761, 0.793353], [-0.793353, 0.608761], [-0.92388, 0.382683], [-0.991445, 0.130526], [-0.991445, -0.130526], [-0.92388, -0.382683], [-0.793353, -0.608761], [-0.608761, -0.793353], [-0.382683, -0.92388], [-0.130526, -0.991445]])


What does the "." represent in your formula?
The multiplcation I suppose.
Why not just write
z^(1.5 + 0.3i)?